

Queue Display
The Display tab of a Queue sets how the queue is drawn on the canvas while the model runs: a line of tokens, one for each entity waiting, colored by entity, by how long it has waited or by an attribute value, or a bar that fills, a chart of the queue over time, or a lane of slots. It is one of a Queue’s six tabs, General, Cost, Logic, Triggers, Display and Advanced, marked with an eye in the panel’s strip, and no other kind of node has it. The ? at the bottom of the strip opens this page.
A note at the top of the tab always reads “Display only. These settings change how the queue is drawn during the run, not how the simulation behaves.”
Display settings never change results
Section titled “Display settings never change results”Every field on the Display tab is for drawing only. The model the simulation runs is built the same whichever style you choose, so a run gives the same results with Count only as with any other style.
The one thing a run sends for the drawing is, with Animation on, the names of the attributes that Color by attribute queues color by, so that each waiting entity’s value can be drawn. The results are the same with and without that list, and scenario runs and PM Optimizer never send it. The drawings themselves are kept apart from the model: they are never saved with it and never part of Undo.
When the drawing shows
Section titled “When the drawing shows”- During a run with Animation on. With Animation off, in Simulation Options or with the eye on the run bar, or in a run of more than one replication, which turns Animation off, a queue with a drawing style keeps its wider shape but draws nothing in it.
- In the queue’s detail view, which shows during a run or with Show Node Details on. Outside a run the drawing area is shown with nothing waiting.
- Cleared when a run starts, on Stop or reset, and between scenarios animated one after another.
Live trace redraws when its count changes and otherwise at most four times a second, and the longest wait in Wait age refreshes at most once a second.
Choosing a style
Section titled “Choosing a style”Queue display style lists Count only and seven drawing styles, in this order: Token line, Color by entity, Wait age, Fill levels, Live trace, Backed-up lane and Color by attribute. Its help line reads “How the queue is drawn during the run. Styles other than Count only make the queue wider. Adjust the spacing around it.”
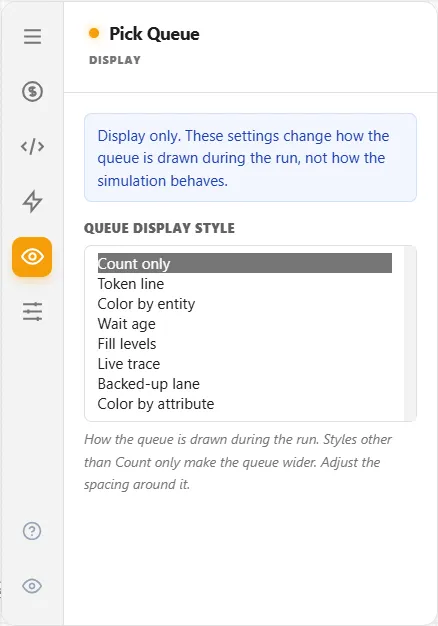
Count only is the default. With it, the tab shows only the note, the style list and its help line, and the queue keeps its usual 160 x 80 box with its Capacity and other rows.
Any other style makes the queue larger and draws in place of those rows:
| Style | Size of the queue |
|---|---|
| Token line, Fill levels, Backed-up lane | 360 x 100 |
| Color by entity, Wait age, Color by attribute | 360 x 120 |
| Live trace | 540 x 120 |
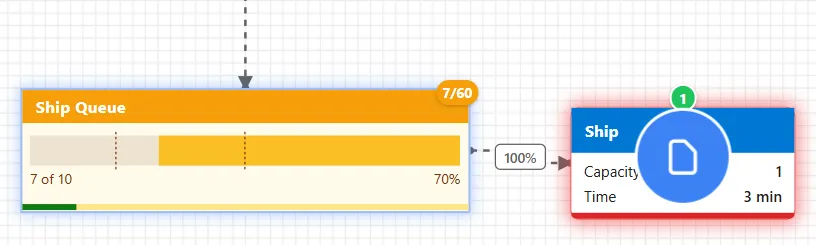
The count still shows in the badge on the queue’s corner, for example “20/20”, and during a run the queue’s tooltip adds a sentence of the style’s own, for example “7 waiting. 70% of 10. At the amber level.”
A style’s own fields show only while that style is chosen. A new queue carries no Display settings, and a field you leave as it is is not stored. A model saved with a style this version cannot draw shows the note “This version cannot draw this queue’s saved display style. The queue is shown as a count.”
How tokens are drawn
Section titled “How tokens are drawn”Token line, Color by entity, Wait age and Color by attribute draw one token for each entity waiting, and share how the tokens are laid out:
- Each token is a small square, or a circle when Token shape is Circle. The oldest sits nearest the next step: the right-most column, top row first, then down and to the left.
- The tokens fill four rows, or five for Color by entity and Color by attribute with the legend off. When more are waiting than fit, the left-most columns read “+N more”.
- Tokens are drawn in arrival order. A queue that does not release first in, first out also says so in its tooltip, for example “This queue releases by last in, first out” (or by attribute value, earliest due date, oldest in system, random order or weighted random order).
- A queue lists at most its 120 oldest entities. When a model has many queues with a drawing style, they share 1,500 among them, never fewer than 20 a queue. The counts and legends stay exact.
Token line
Section titled “Token line”One token for each entity waiting, oldest nearest the next step.
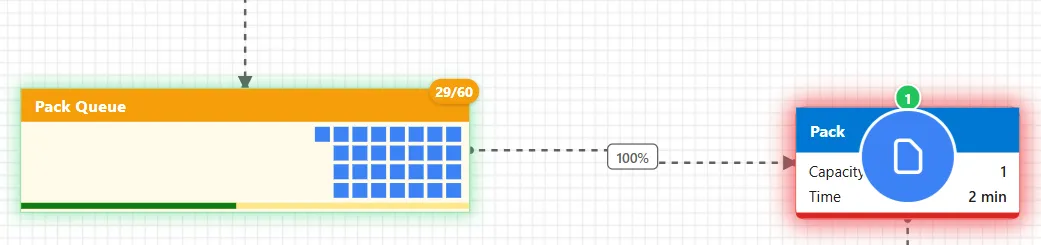
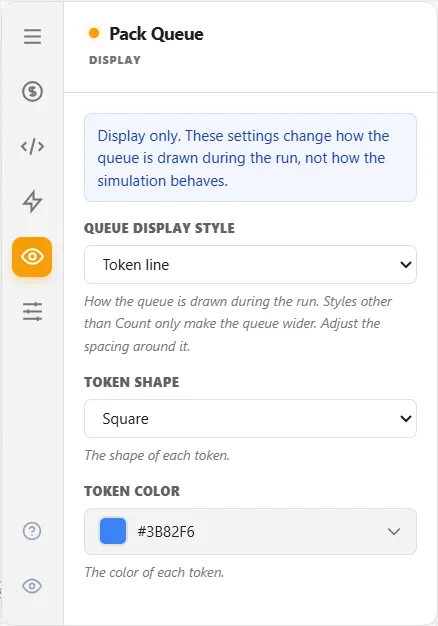
Its two fields are the ones in Figure 1:
- Token shape: Square or Circle. Square to begin with.
- Token color: the color of every token, #3B82F6 (blue) to begin with.
Its tooltip reads “N waiting. Shown in arrival order.”
Color by entity
Section titled “Color by entity”The tokens of Token line, each in the color of its entity (gray for an entity of no known type), with a legend line such as “Order 18 Return 5” that gives the exact count of each, and “+N more” when the legend runs out of room.
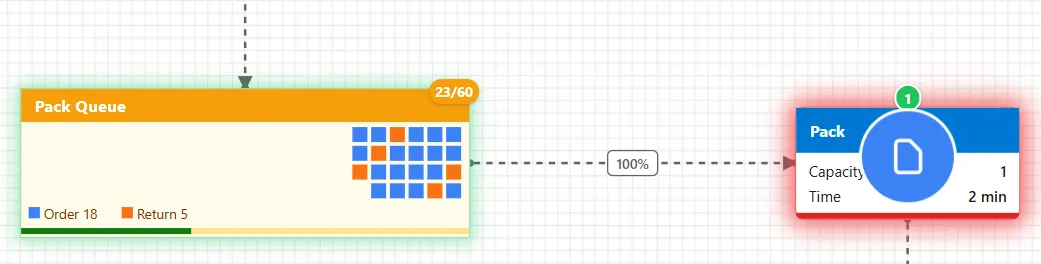
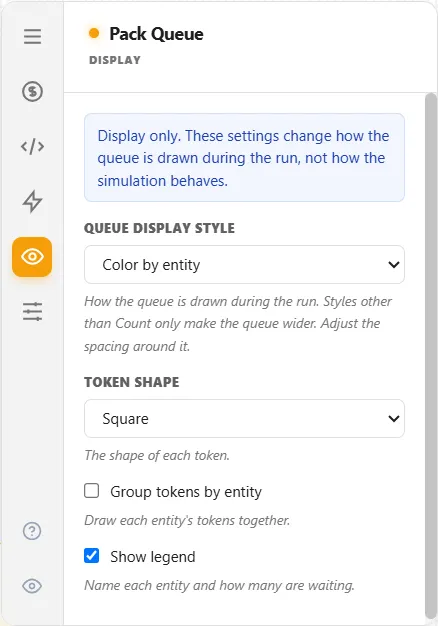
- Token shape: as for Token line.
- Group tokens by entity: off to begin with. “Draw each entity’s tokens together.”
- Show legend: on to begin with. “Name each entity and how many are waiting.”
Its tooltip reads, for example, “N waiting. Order 18, Return 5. Shown in arrival order.”, or ends “Grouped by entity, then in arrival order.” with the grouping on.
Wait age
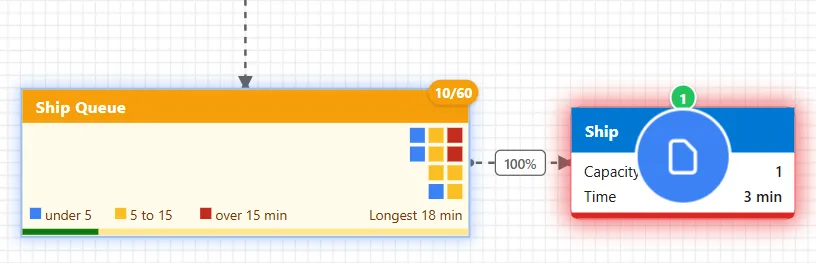
Section titled “Wait age”The tokens, each colored by how long its entity has waited: the token color under Amber after, amber up to Red after, and red at or over it. The legend reads, for example, “under 5”, “5 to 15” and “over 15 min”, and on the right “Longest 18 min”.
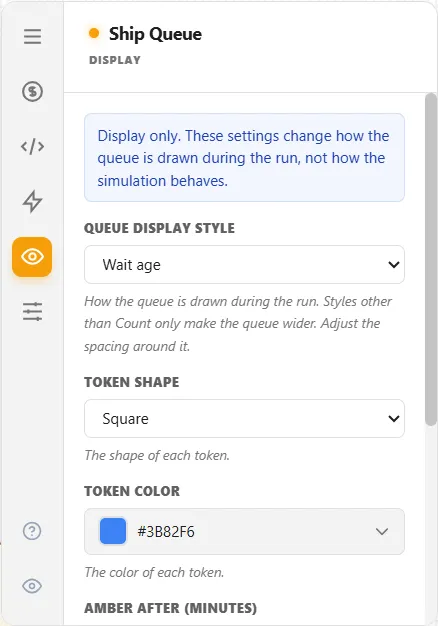
- Token shape and Token color: as for Token line.
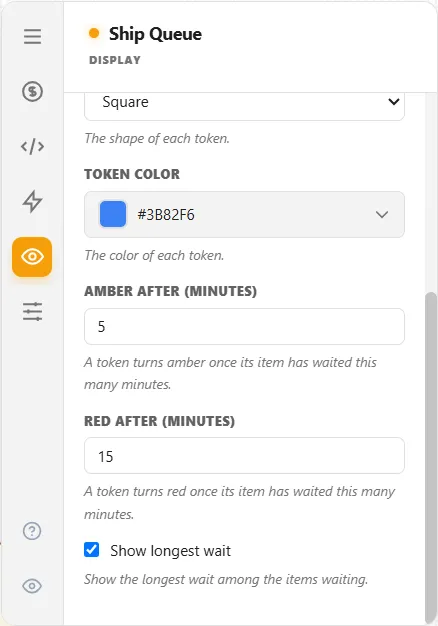
- Amber after (minutes): 5 to begin with, at least 1.
- Red after (minutes): 15 to begin with, at least 1.
- Show longest wait: on to begin with.
When Amber after is not below Red after, a note reads “Amber after is not below Red after. The queue uses the smaller as amber and the larger as red.”
A wait is shown in minutes (“N min”) under 120 minutes, in hours (“N.N hr”) under 48 hours, and in days (“N.N days”) beyond. Waits need a run going: otherwise the tooltip says “Wait times show while the model runs.”
Fill levels
Section titled “Fill levels”A bar that fills from the right, the next step’s side: green under Amber from, amber under Red from, and red at or over it. Two dashed ticks mark the two levels, and under the bar the count and the share read, for example, “7 of 10” and “70%”.
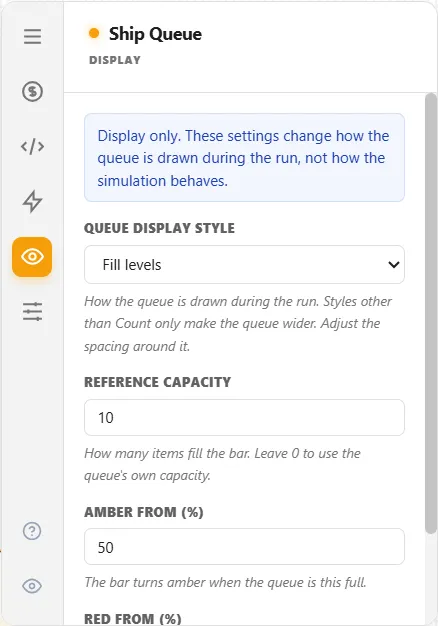
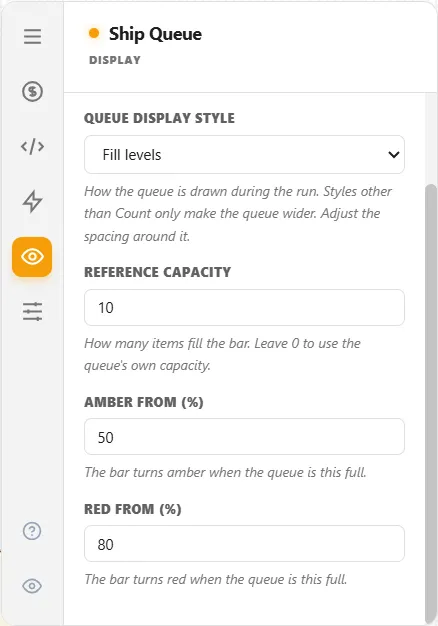
- Reference capacity: 0 to begin with. “How many items fill the bar. Leave 0 to use the queue’s own capacity.”
- Amber from (%): 1 to 100, 50 to begin with.
- Red from (%): 1 to 100, 80 to begin with.
A queue with no capacity to measure against, an unlimited queue with Reference capacity at 0, shows “Set a reference capacity on the Display tab to see the fill.” and “N waiting”. When Amber from is not below Red from, a note reads “Amber from is not below Red from. The queue uses the smaller as amber and the larger as red.”
Live trace
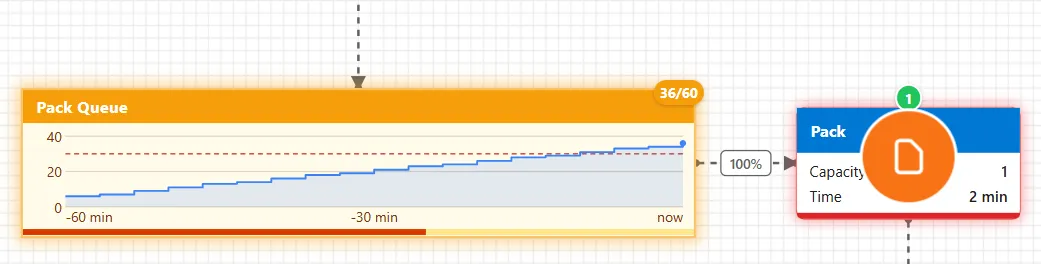
Section titled “Live trace”A step chart of how many have waited over the most recent stretch of the run, marked “-60 min”, “-30 min” and “now” along the bottom, with the area under the line lightly filled, a dot at “now” and, if you set one, a dashed red reference line. When the queue grows past the top of the scale, the scale grows to 1.1 times the highest count.
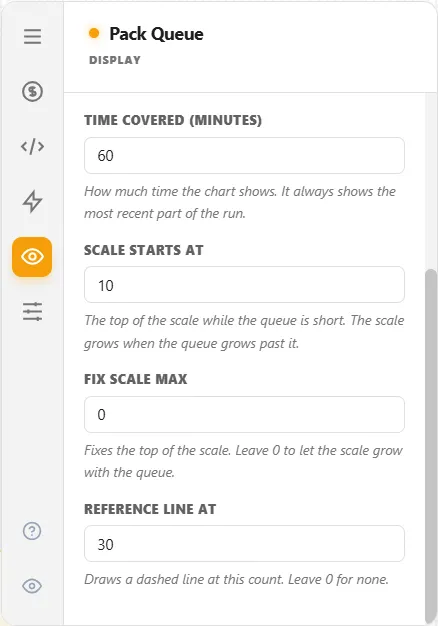
- Time covered (minutes): 60 to begin with.
- Scale starts at: 10 to begin with.
- Fix scale max: 0 to begin with, which lets the scale grow.
- Reference line at: 0 to begin with, for no line.
Its tooltip reads “N waiting. Highest in the last 60 min: P.”, and with a reference line, “Reference line at R.” as well.
Backed-up lane
Section titled “Backed-up lane”A lane of slots that fills from the right. A slot is green in the half nearest the next step, amber up to 80% and red beyond, and the lane’s outline turns red when the lane is full; an unlimited queue is never red. When the lane is full, a held zone on its left shows, as red tokens, what the step before is holding because this queue is full, and the line under it reads, for example, “20 of 20 · 3 held by the prior step”. A large capacity is drawn as at most 22 blocks, with “each block = N”.

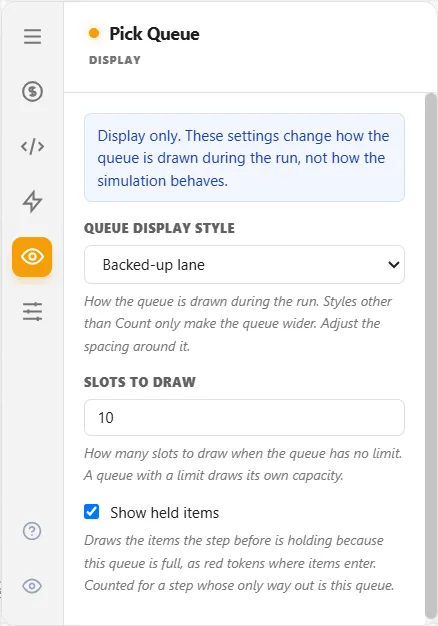
- Slots to draw: 1 to 22, 10 to begin with. Used only when the queue has no limit; a queue with a limit draws its own capacity.
- Show held items: on to begin with. “Counted for a step whose only way out is this queue.”
Color by attribute
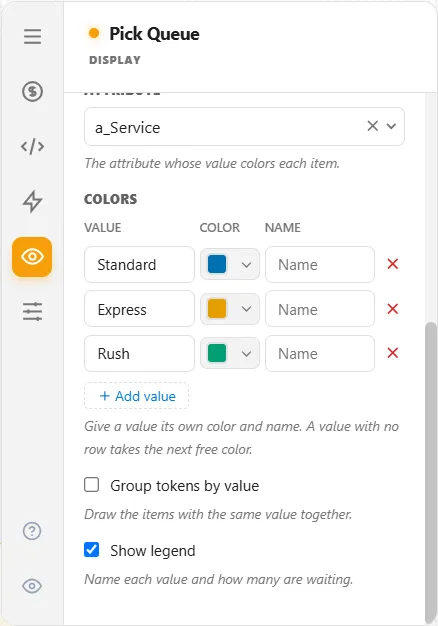
Section titled “Color by attribute”The tokens, each in the color of the value its entity had for an attribute when it entered the queue, with a legend such as “Standard: 12 Express: 4 Rush: 4”.

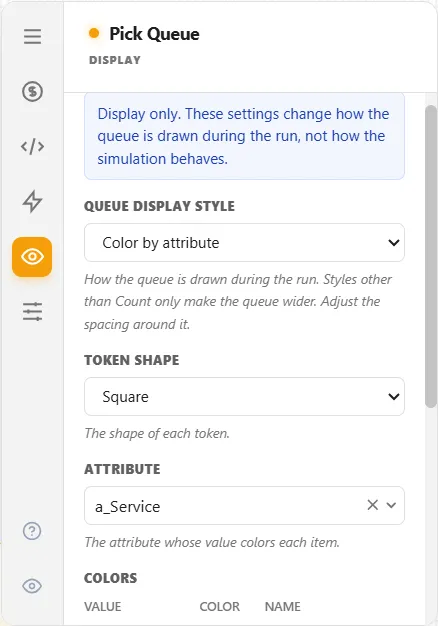
- Token shape: as for Token line.
- Attribute: the attribute whose value colors each entity (“Pick an attribute”).
- Colors: a table of Value, Color and Name, with a button to remove a row. Add value adds a row and, for a Descriptive attribute, Add the attribute’s values adds a row for each of its values.
- Group tokens by value: off to begin with.
- Show legend: on to begin with.
Until an attribute is picked, the tooltip reads “N waiting. Pick an attribute on the Display tab to color the items.” Once one is, it counts each value and says how the tokens are ordered, for example “20 waiting. a_Service Standard: 12, Express: 4, Rush: 4. Colors show the value each item had when it entered the queue. Shown in arrival order.”
Limits on the colors
Section titled “Limits on the colors”- At most 7 colors. Your rows come first. A value with no row takes the next free color. Once the seven colors are taken, every further value, and an entity with no value, is Other, in gray. Values match without regard to letter case. A value given a second row shows “This value already has a row. Only the first one is used.”
- At most 4 attributes in one run. Across the model, only four attributes can be colored in a run. An attribute beyond those four shows “Only 4 attributes can be colored in one run. This one is not sent, so its items show as Other.”
- No Date attributes. A Date attribute shows “A Date attribute cannot be colored. Pick a number or a Descriptive attribute.”, and an attribute that is not declared shows “This attribute is not declared. Pick another attribute.”
- Animation on. The values are sent only for a run with Animation on.