

The Bulk report
A fluid model’s output does not live on the report’s opening page. It lives on the Bulk tab.
Finding it
Section titled “Finding it”Levels over time
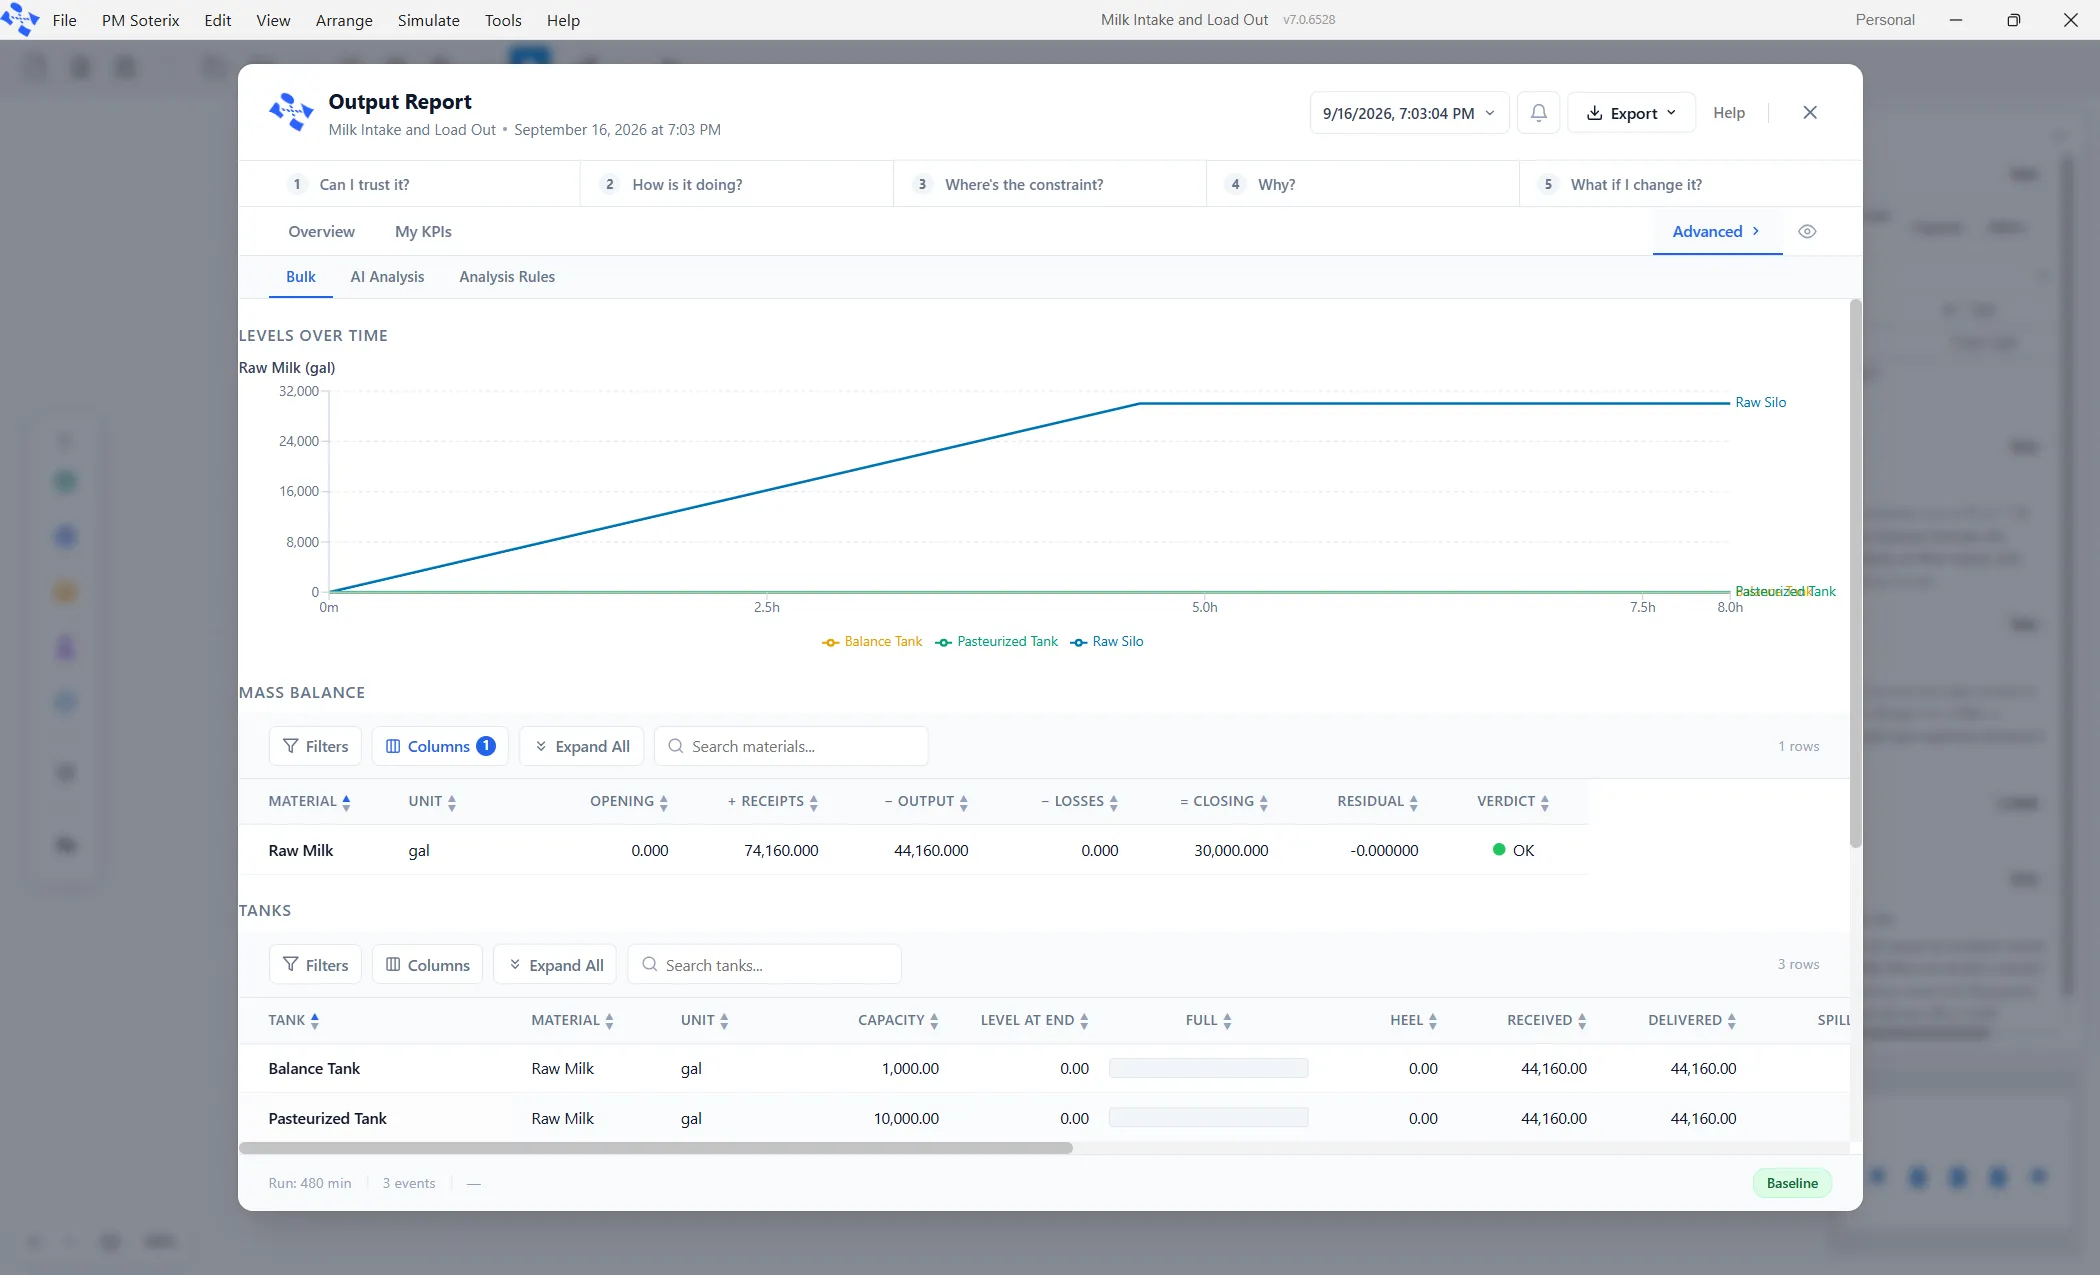
Section titled “Levels over time”The first thing on the Bulk tab is a chart of every vessel’s level through the run. A straight climb is a constant difference between what comes in and what goes out. A flat top is a vessel that filled and stopped accepting. A flat line on the bottom is a vessel that passed everything straight through without ever holding a gallon.
The mass balance
Section titled “The mass balance”Under the chart is one row per material: opening, receipts, output, losses, closing, a residual and a verdict.
The Tanks table
Section titled “The Tanks table”One row per vessel, with the columns that answer whether each is the right size: capacity, received, delivered, level at end, average level (which is time weighted), the share of the run spent full, the share spent at the heel, and turnovers, which is delivered divided by working volume. A vessel that turns over many times a shift is a buffer; one that turns over about once is storage.
The Transfer Lines table
Section titled “The Transfer Lines table”One row per pipe, and this is usually where the answer is.
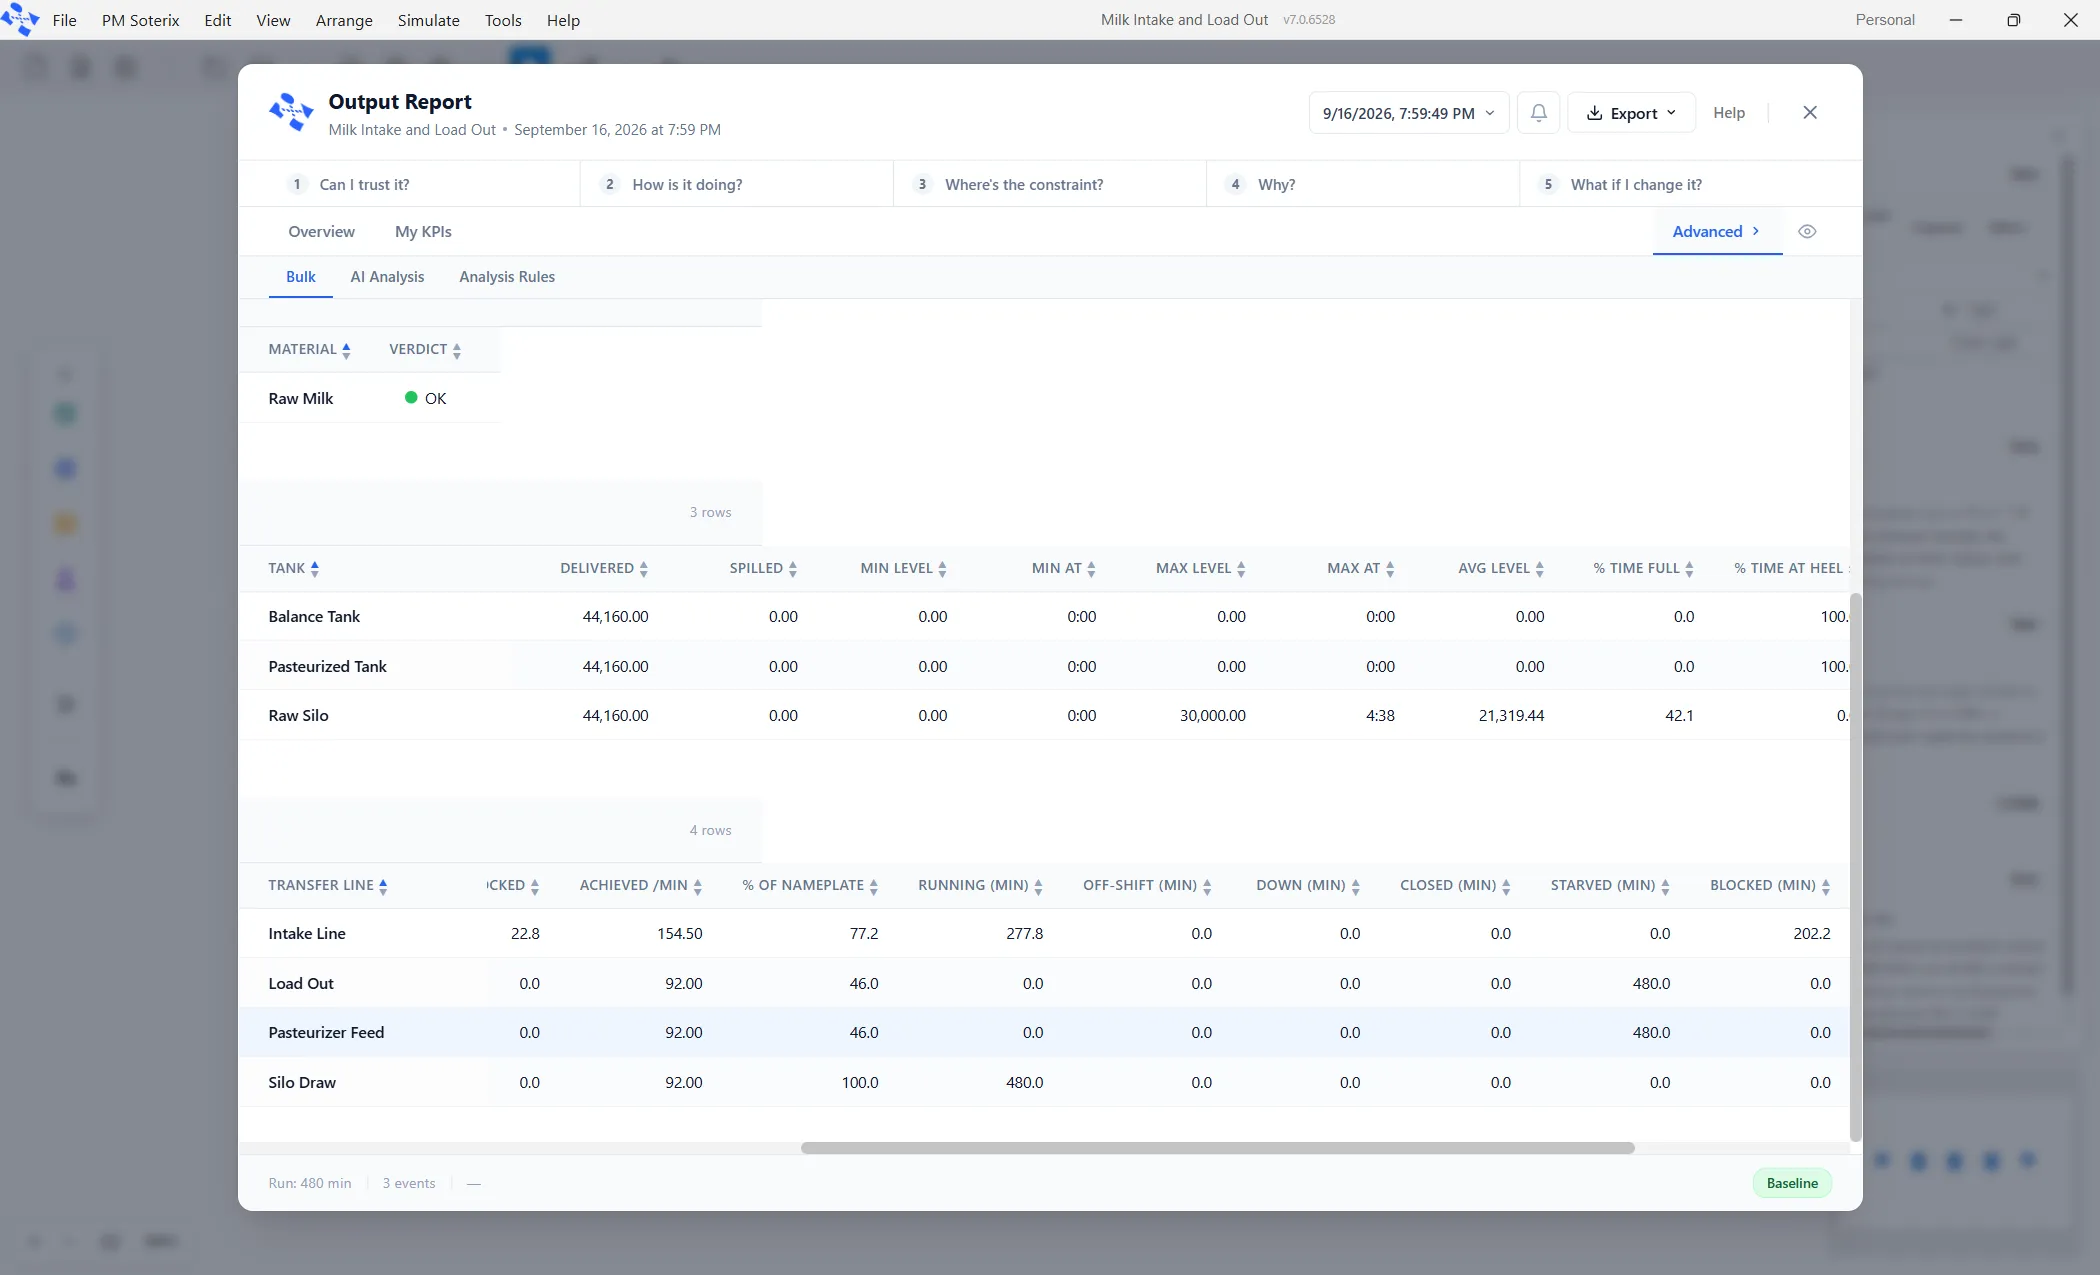
Each pipe’s time is split across six buckets that always add up to the length of the run: Running, Off-shift, Down, Closed, Starved and Blocked. Down outranks the rest, because a broken pump is broken whatever its tanks are doing. Starved is the source failing to keep the pipe fed at its rated speed; Blocked is the destination failing to take what the pipe offers.
Reading it
Section titled “Reading it”A pipe can read Starved for the whole run and still have moved a great deal. Starved means it never reached its rated speed, not that nothing moved. To find the constraint, look down the percent of nameplate column: the pipe at 100 percent while every other pipe runs below its own rating is the one that sets the pace for the whole plant.