

Responses
A response is an output you want an experiment to measure. Every configuration reports the same responses, so you can compare them on equal footing, and the responses you score become the goal the search works toward.
The response catalog
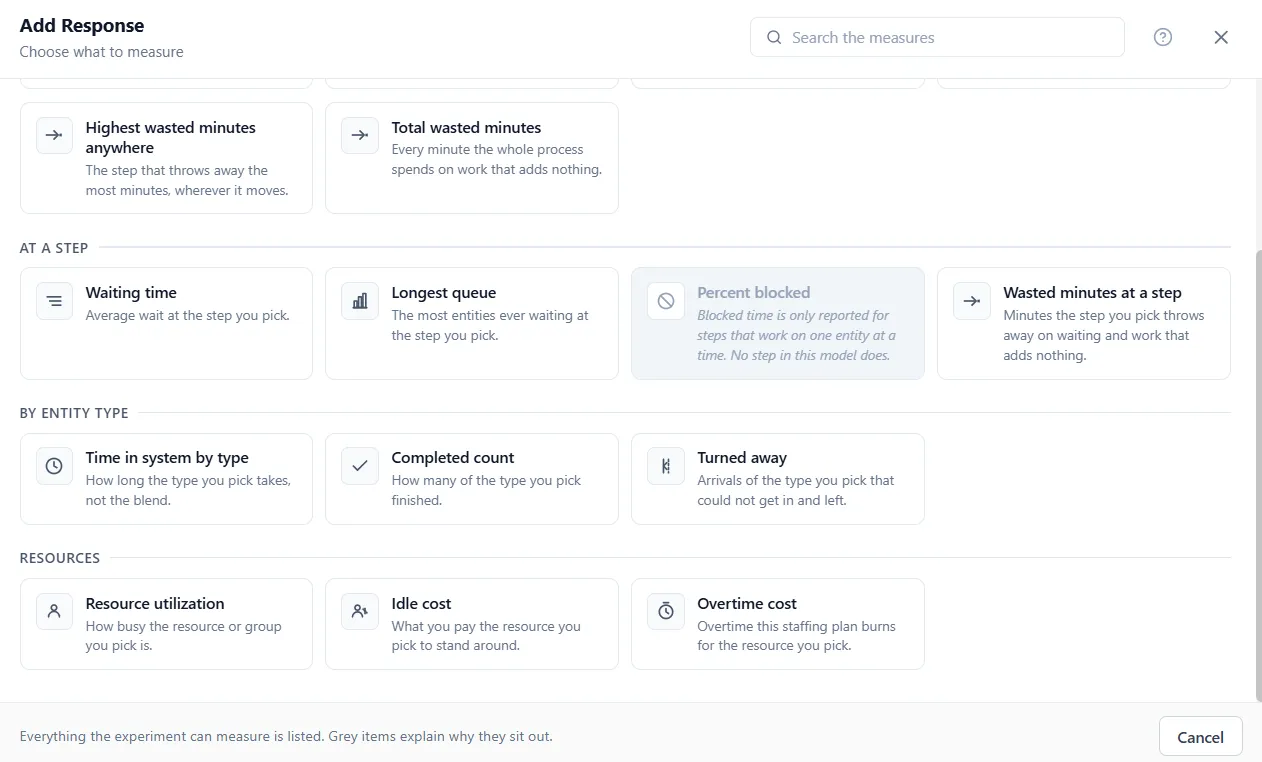
Section titled “The response catalog”Add Response lists everything the experiment can measure, in plain language, in six groups.
Overall process:
- Throughput: entities completed in a run.
- Average time in system: time from arrival to done, all types weighted together.
- Cost per entity: what the average entity costs, start to finish.
- Process efficiency: how much of each entity’s journey was real work.
- Work in process: work still in the pipe when the run ends.
- Longest wait anywhere: the worst average wait in the process, wherever it happens.
- Busiest step utilization: how hard the busiest step is working.
- Total run cost: what the whole run cost.
- Highest wasted minutes anywhere and total wasted minutes: time spent on work that adds nothing.
At a step: waiting time, longest queue, percent blocked, and wasted minutes at a step you pick.
By entity type: time in system, completed count, and turned-away count for a chosen type.
Resources: utilization, idle cost, and overtime cost for a resource or group you pick.
Inventory: service level and inventory cost.
Your data: a variable’s value or a single array cell, for anything you measure with your own logic.
Why some measures are greyed out
Section titled “Why some measures are greyed out”A measure that does not apply to your model is shown in grey, with the reason on the row. For example, percent blocked only means something for a step that works on one entity at a time, so if no step in your model does, that measure sits out. This keeps the list honest: everything shown is something your model can actually report.
Each response’s row
Section titled “Each response’s row”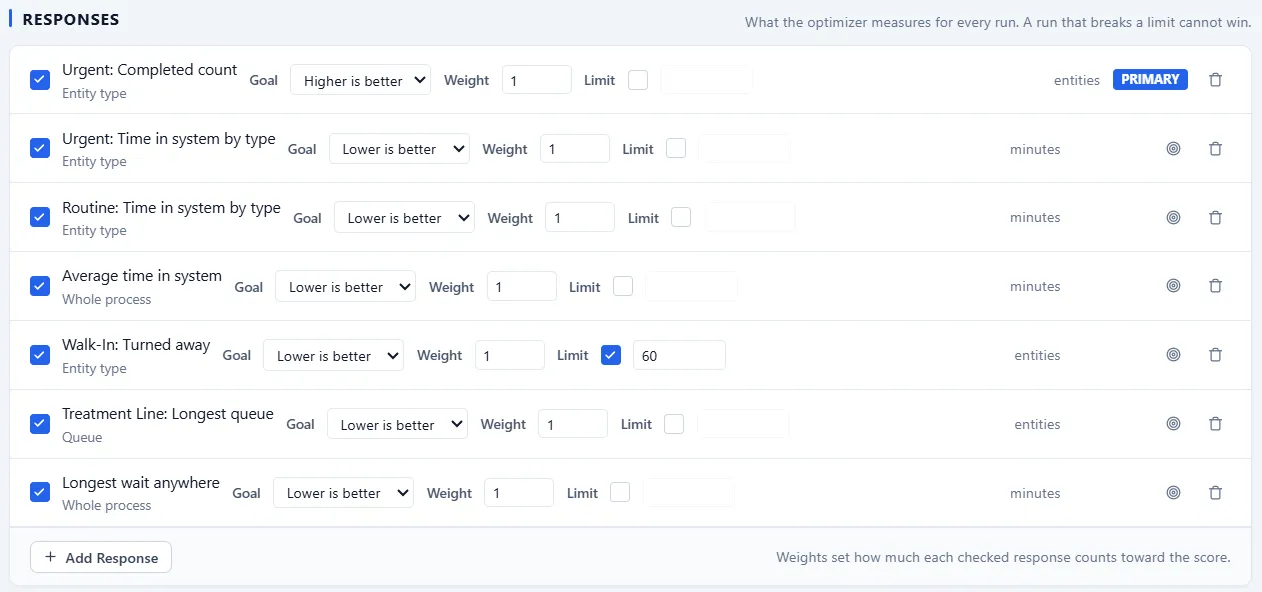
Back on Define, every response you added is a row with the same controls:
- A checkbox that says whether the response counts toward the score. Unchecked responses are still measured and shown for every configuration; they just do not steer the search.
- A Goal: Lower is better or Higher is better.
- A Weight, shown when two or more responses count, that sets how much this one pulls the score.
- A Limit checkbox and number, for a bound the result must respect. A configuration that breaks it still runs but cannot win.
- The Primary badge on the one response that leads the search and titles the charts.
The Define article covers how goals, weights, and limits combine into what best means.