

The emergency department report: headline and rules
With the Emergency Department lens on, the Output Report shows two strips above its tabs. The headline strip is seven tiles. The Rules strip under it names the lines the report is scored against.
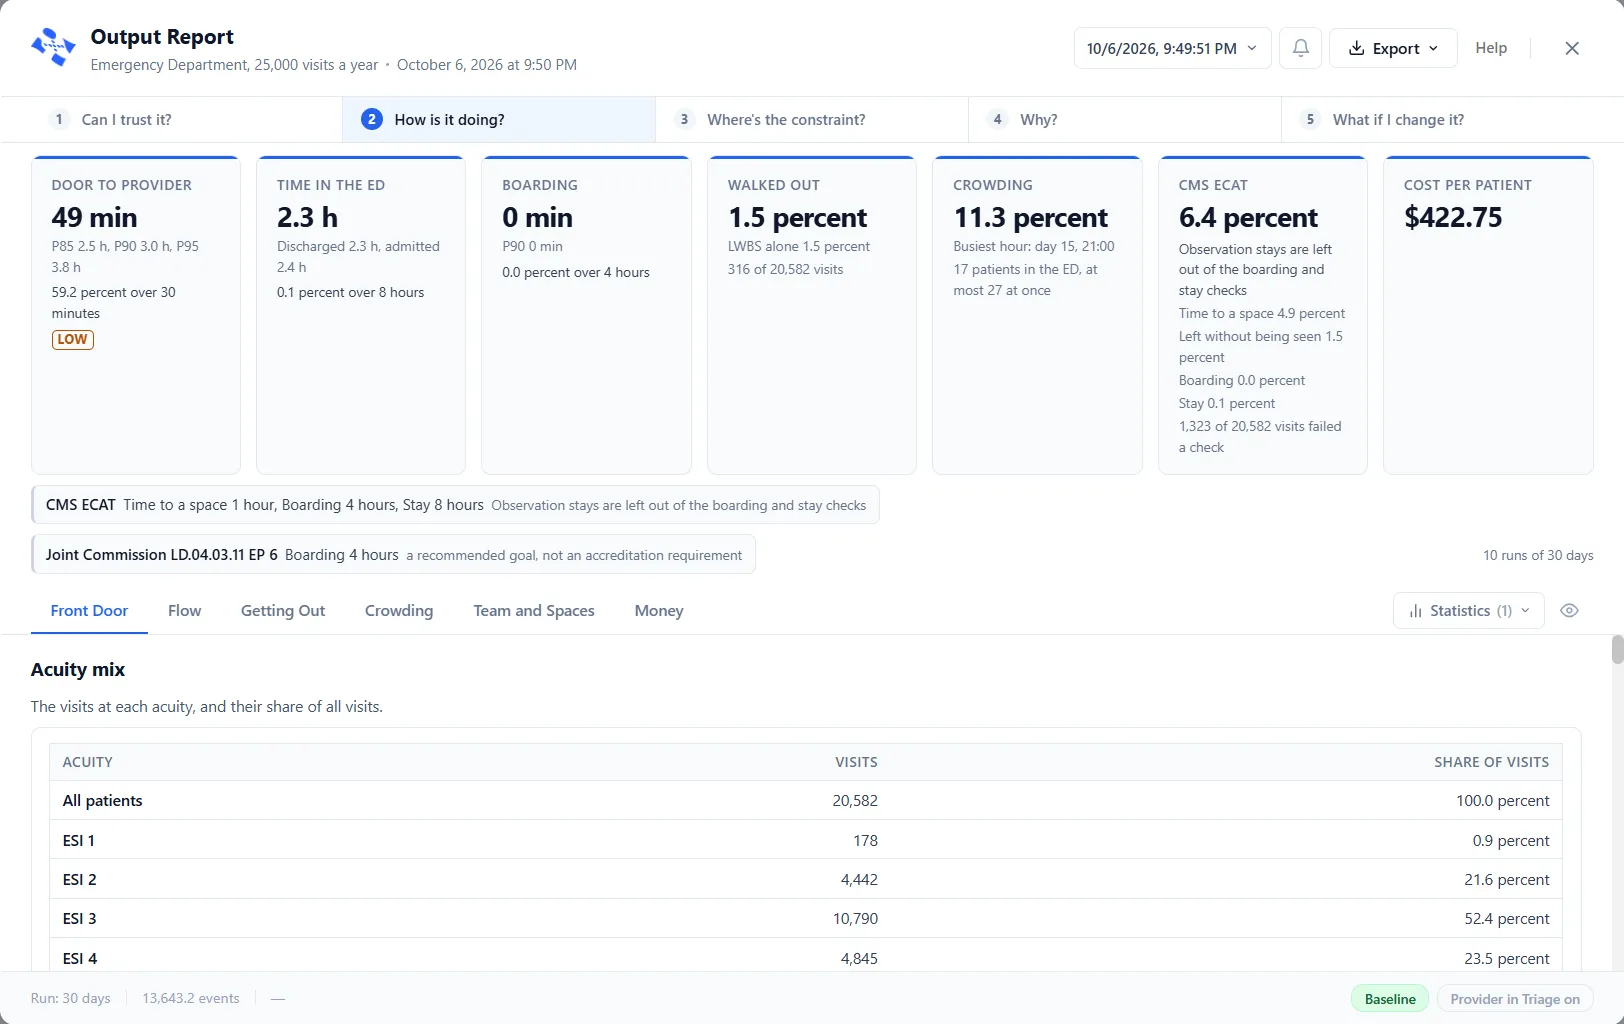
The seven tiles
Section titled “The seven tiles”Each tile has a name, a figure and lines under it. Rest the pointer on a name to read the tile’s sentence, and on a figure to see how many visits stand behind it and the range across the runs. The numbers here are the ones in Figure 1.
| Tile | Its sentence | Under the figure in Figure 1 |
|---|---|---|
| Door to provider | How long patients wait from arrival to first being seen by a doctor or practitioner. | 49 min, then P85 2.5 h, P90 3.0 h and P95 3.8 h, then “59.2 percent over 30 minutes” with a LOW tag |
| Time in the ED | How long a visit lasts, from the door to leaving the department, for discharged and admitted patients. | 2.3 h, then “Discharged 2.3 h, admitted 2.4 h” and “0.1 percent over 8 hours” |
| Boarding | How long admitted patients wait in the department after the decision to admit, until they leave for a ward. | 0 min, then “P90 0 min” and “0.0 percent over 4 hours” |
| Walked out | The share of visits where the patient left before treatment was complete, with those who left unseen shown apart. | 1.5 percent, then “LWBS alone 1.5 percent” and “316 of 20,582 visits” |
| Crowding | How full the treatment spaces are at the busiest hour of the run, and how many patients are inside. | 11.3 percent, then “Busiest hour: day 15, 21:00” and “17 patients in the ED, at most 27 at once” |
| CMS ECAT | The share of visits that fail at least one of the four CMS ECAT checks: space, walk-out, boarding and stay. | 6.4 percent, then the note “Observation stays are left out of the boarding and stay checks”, the share failing each check (Time to a space 4.9 percent, Left without being seen 1.5 percent, Boarding 0.0 percent, Stay 0.1 percent) and “1,323 of 20,582 visits failed a check” |
| Cost per patient | The running cost of the department over the measured period divided by the visits that ended in it. | $422.75 |
Reading the figures. On the three time tiles, Door to provider, Time in the ED and Boarding, the figure is the P50, the time half the patients came in under. P85, P90 and P95 are the times that 85, 90 and 95 in every 100 patients came in under, as in the tables of the tabs. A line such as “59.2 percent over 30 minutes” is the share of patients whose time went over that line.
LOW. A LOW tag marks a line with weak evidence behind it, here the standard 30 minute line for Door to provider. Rest the pointer on it to see where the line comes from. A different line carries no tag.
Lines you have not set. A tile whose line the run did not hold says so, for example “No 8 hour line in this run. Set one under Simulation Options, Report rules, Standard lines.” See Settings for an emergency department model for the Report rules group.
Baseline. Pick a scenario at the foot of the report and each tile adds a small gray line with the Baseline’s figure, such as “Baseline 49 min”. The line reads “Baseline not measured” when the Baseline has no figure for that tile. Cost per patient shows the tiles with these lines.
The Rules strip
Section titled “The Rules strip”Under the tiles, the Rules strip names the rules the report checks against, one chip each. In Figure 1 it holds two:
- CMS ECAT: “Time to a space 1 hour, Boarding 4 hours, Stay 8 hours”, with the same observation note as the tile.
- Joint Commission LD.04.03.11 EP 6: “Boarding 4 hours”, with the note “a recommended goal, not an accreditation requirement”.
Rest the pointer on a rule’s name to see where the rule comes from. At the right end of the strip a line says how the report was run: “10 runs of 30 days”.
Locale rules
Section titled “Locale rules”Choose another Locale in Simulate ▸ Options and the strip adds a chip of its own after these two:
- Canada: CIHI: 90th percentile time to physician
- Australia: NEAT: 90% within 4 h
- United Kingdom: NHS: 95% within 4 h
The Australia and United Kingdom chips say what share of visits stayed within four hours, with the target and the word met or below. The Canada chip gives the P90 time.