

Running an experiment
The Run step is a live dashboard. Once you start an experiment, it shows progress as it goes, so you always know how far along it is and how it is doing.
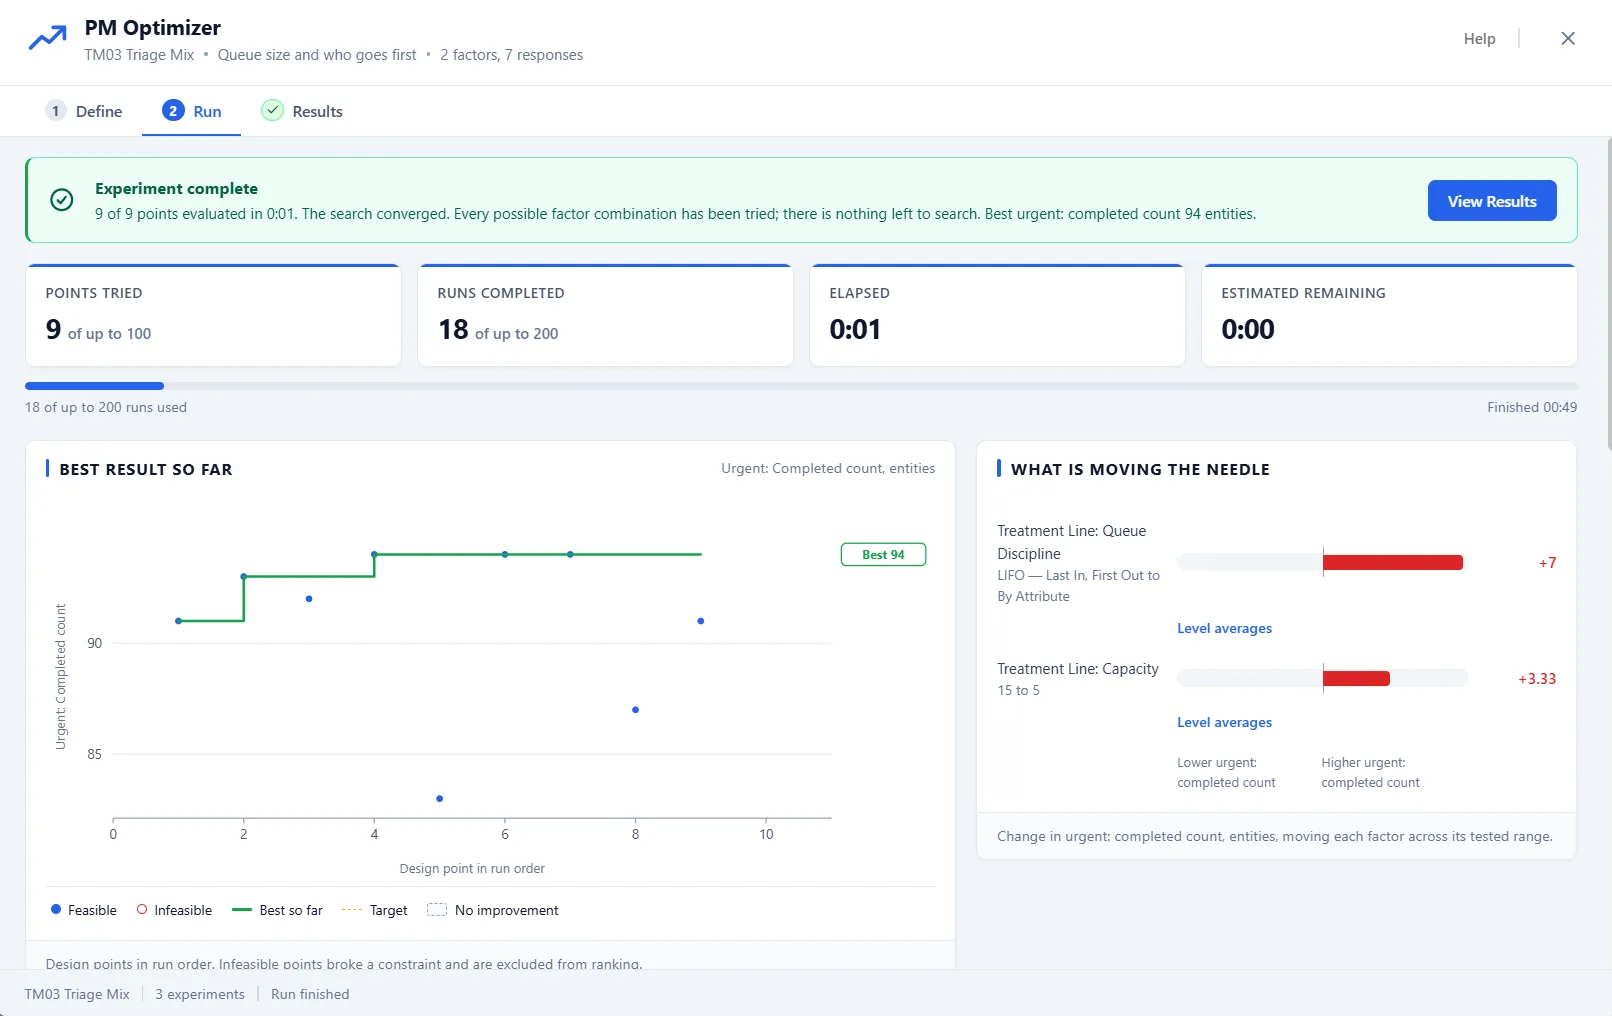
Progress at a glance
Section titled “Progress at a glance”Four cards along the top track points tried, runs completed, time elapsed, and estimated time remaining, with a progress bar underneath showing how much of the run budget is used. Because the search knows its budget, the estimate is honest about how much is left.
Best result so far
Section titled “Best result so far”The chart plots each configuration as it finishes, in the order it ran, against your primary response. A line traces the best result found so far, so you can watch it climb and then level off as the search settles. Feasible points are filled; points that broke a limit show as hollow rings and are excluded from the ranking.
What is moving the needle
Section titled “What is moving the needle”Beside the chart, a panel ranks the factors by how much moving each one across its tested range changed the result, longest bar first. It fills in when the run completes, once the whole picture is in: while the run is still going, the panel says the answer is on its way. The same chart appears on Results as the main effects.
Every option gets a fair test
Section titled “Every option gets a fair test”By default, each configuration is tested against the same random conditions, replication for replication. This paired comparison means the differences you see come from the settings you changed, not from one configuration happening to get an easier run. It makes the comparison much sharper at no cost to you.
Stopping
Section titled “Stopping”Stop ends the run. The points gathered so far stay on screen for you to read, but a stopped run is not a finished experiment: it is not saved with the model, and the Results tab stays locked. Run the experiment again when you want a result you can rank and keep. A Smart Optimizer run also stops on its own when better results stop coming.
When it finishes
Section titled “When it finishes”At completion, the top of the dashboard becomes a summary card: how many points were evaluated, how long it took, and the best value found, with one button, View Results. The window then opens the Results step for you, where the ranked table and the export live.
If the app closes in the middle of a run, nothing gathered is lost silently: the next time you open PM Optimizer, it offers the stranded results, to export as a spreadsheet or to discard.