

Settings for an emergency department model
With the Emergency Department lens on, a model has a few settings that other models do not, and its fields read in the department’s own words. Some of the settings are in the Simulation options window. The rest are on the properties panel of an element.
In Simulation options
Section titled “In Simulation options”Open Simulate ▸ Options (Ctrl+Shift+O). The window is described in Simulation Options. With the lens on, the Run group has a Locale row, and two more groups, Costing and Report rules, come after Units.
Run and Locale
Section titled “Run and Locale”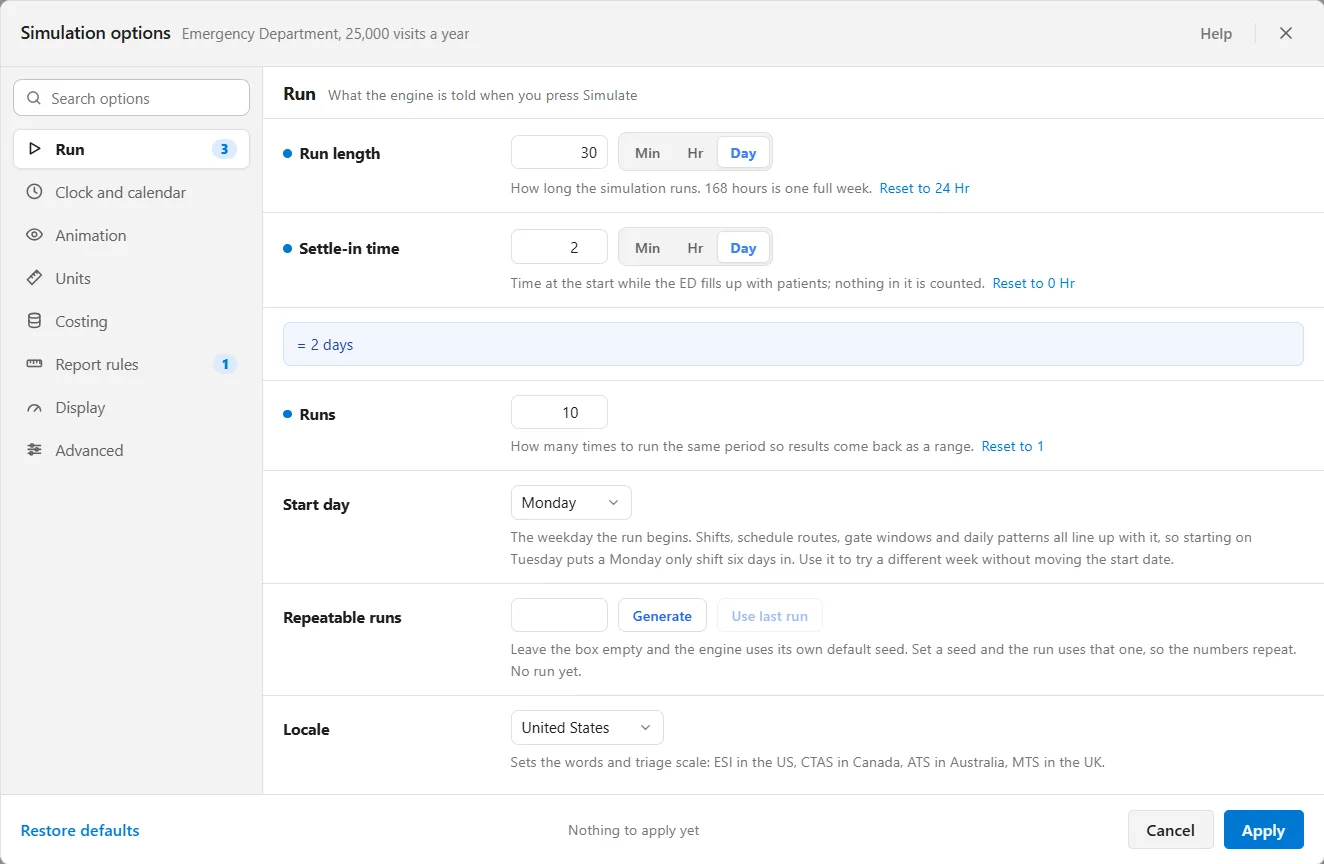
Here Runs and Settle-in time stand where other models read Replications and Warmup length. Settle-in time is “Time at the start while the ED fills up with patients; nothing in it is counted.”
Locale offers United States, Canada, Australia and United Kingdom, and its line reads “Sets the words and triage scale: ESI in the US, CTAS in Canada, ATS in Australia, MTS in the UK.” Australia and the United Kingdom also say A&E where the report says ED, and clinician where it says provider. Each locale but the United States adds a rule to the Rules strip: see The emergency department report: headline and rules.
Costing
Section titled “Costing”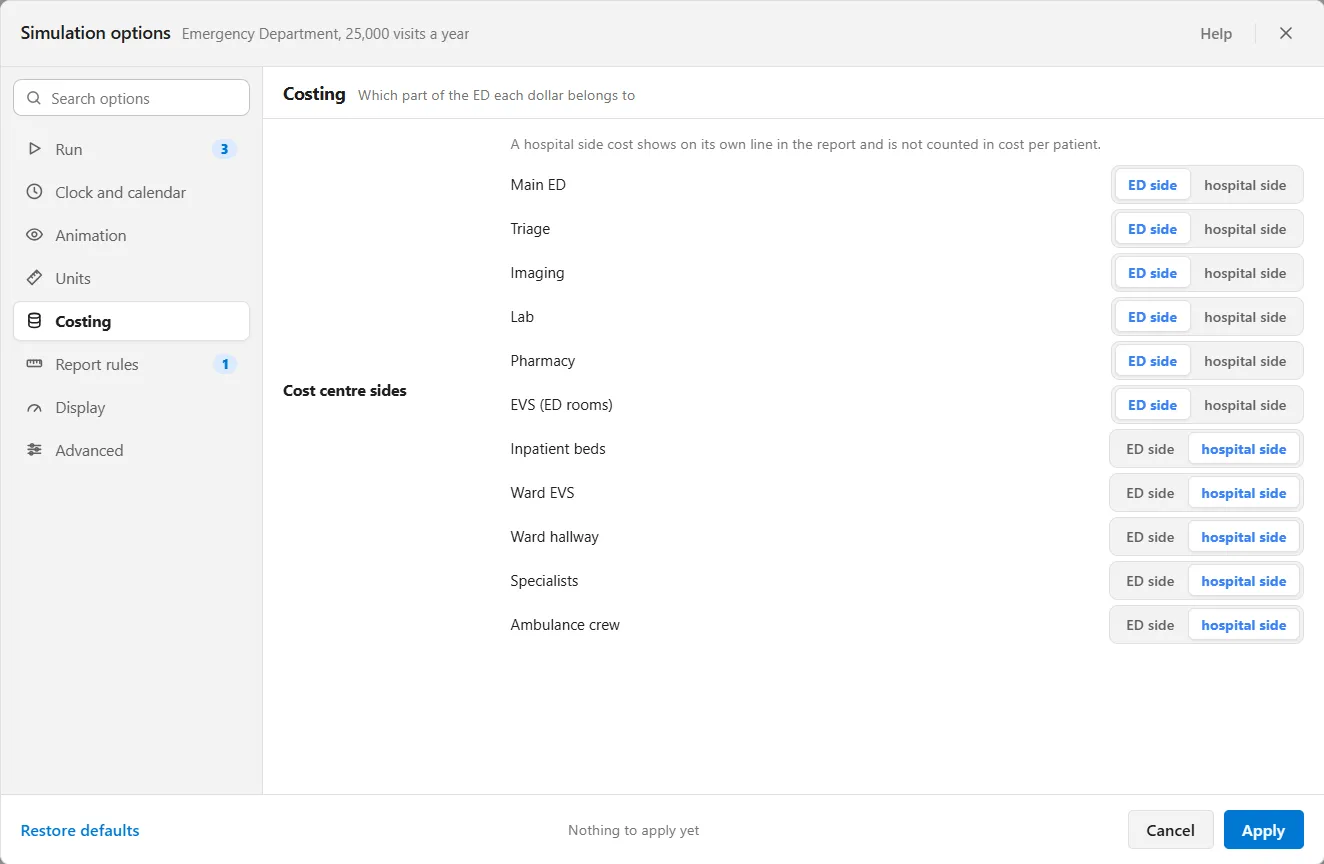
The group is headed “Which part of the ED each dollar belongs to”. Its one row, Cost centre sides, has a line for each name the lens brings and each name you enter in a Cost centre box. A name you enter joins the list on the ED side. Each line offers ED side and hospital side, and the sentence above the list says what the choice does: “A hospital side cost shows on its own line in the report and is not counted in cost per patient.”
Report rules
Section titled “Report rules”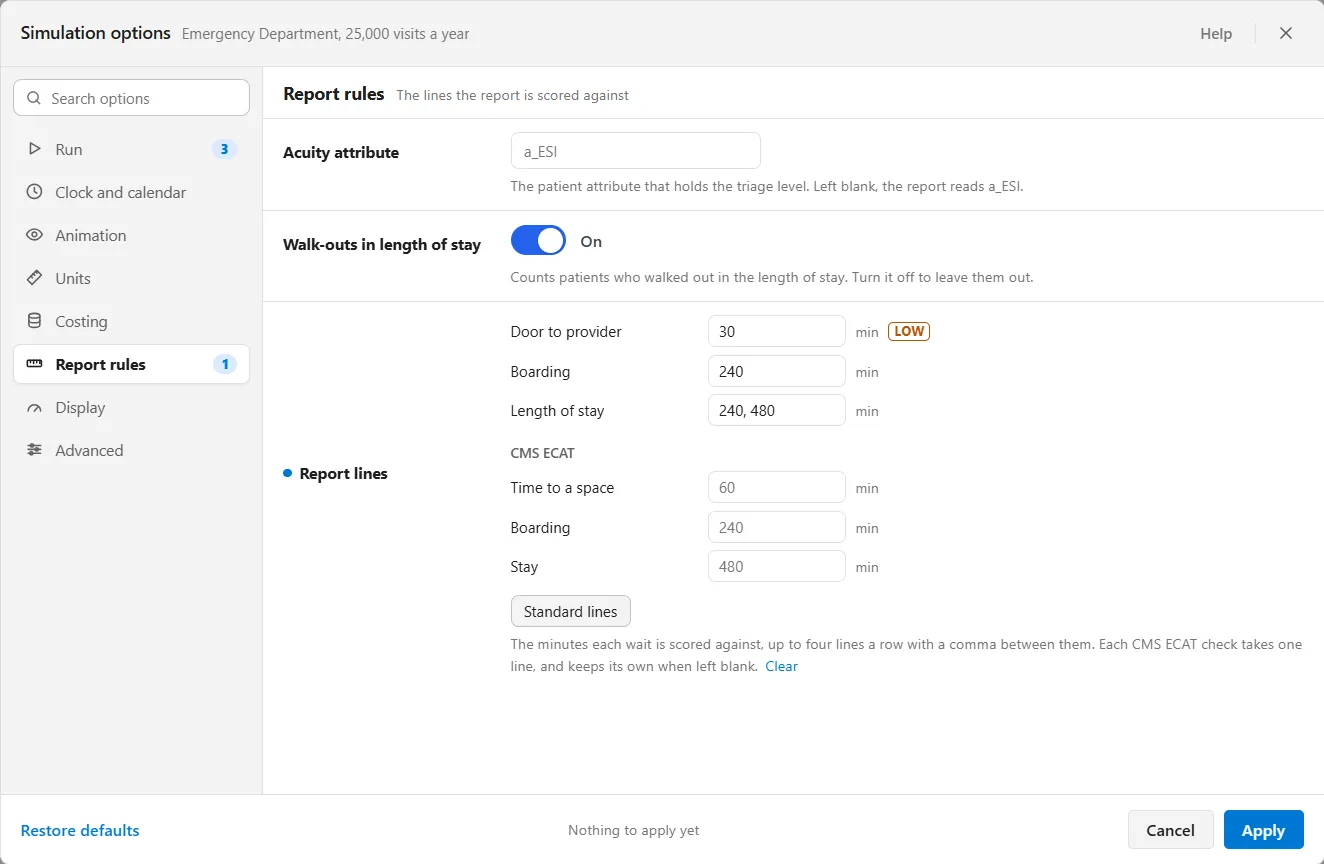
- Acuity attribute is “The patient attribute that holds the triage level.” Left blank, the report reads a_ESI.
- Walk-outs in length of stay is a switch, on to start: “Counts patients who walked out in the length of stay. Turn it off to leave them out.” With it off, the Time in the ED tile says “Walk-outs are left out of these times”.
- Report lines sets “The minutes each wait is scored against, up to four lines a row with a comma between them.” There is a row each for Door to provider, Boarding and Length of stay. Under CMS ECAT, each check takes one line and keeps its own, shown in gray, when its box is left blank. Standard lines puts the standard line back in each of the first three rows, and Clear takes every line out. A LOW tag marks a line with weak evidence behind it.
The headline tiles and the Over columns of the Flow and Getting Out tables count against these lines: Length of stay at 240 and 480 gives Over 4 hours and Over 8 hours. See The emergency department report tabs.
On the properties panel
Section titled “On the properties panel”Select an element and its properties panel shows these when the lens is on.
Cost centre
Section titled “Cost centre”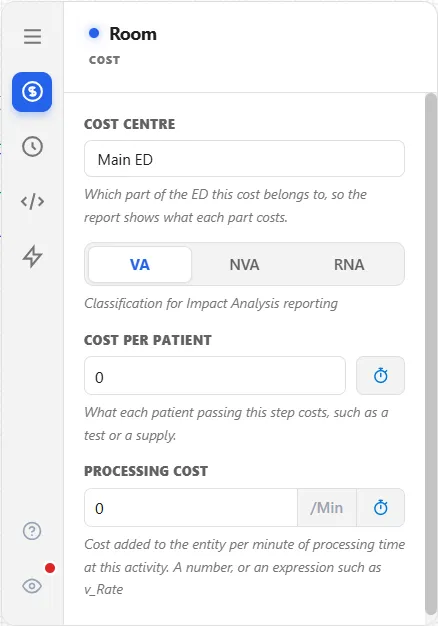
A resource, a step and a route each have a Cost centre box on their Cost tab: “Which part of the ED this cost belongs to, so the report shows what each part costs.” The names you enter fill the Cost centre sides list, and the Money tab of the report shows what each part costs. See Cost per patient.
Rooming needs
Section titled “Rooming needs”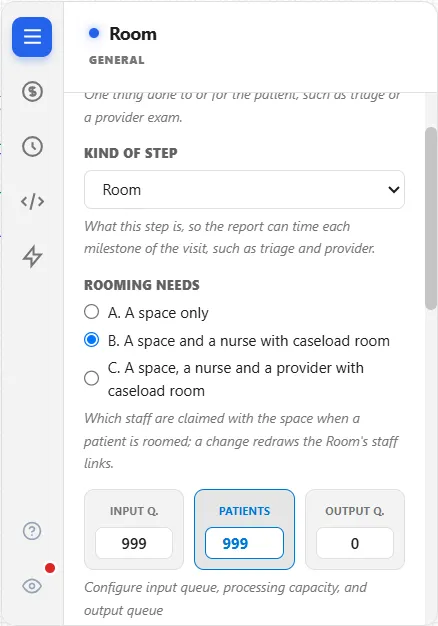
On a step whose Kind of step is Room, the General tab has Rooming needs: “Which staff are claimed with the space when a patient is roomed; a change redraws the Room’s staff links.” There are three choices:
- A. A space only
- B. A space and a nurse with caseload room, the default
- C. A space, a nurse and a provider with caseload room
Until the Nurses tile is on the canvas, a hint reads “Place the Nurses tile to offer B and C.” The Front Door tab of the report reads the choice back.
Kind of step
Section titled “Kind of step”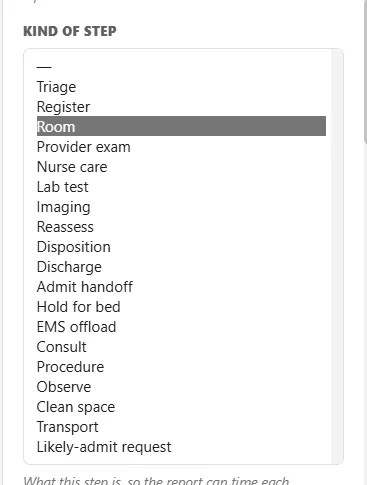
Kind of step, on the same tab, says what a step is “so the report can time each milestone of the visit, such as triage and provider.” It offers nineteen kinds: Triage, Register, Room, Provider exam, Nurse care, Lab test, Imaging, Reassess, Disposition, Discharge, Admit handoff, Hold for bed, EMS offload, Consult, Procedure, Observe, Clean space, Transport and Likely-admit request. The blank first entry is for a step that is not one of the steps the report times.
Leaves the team of
Section titled “Leaves the team of”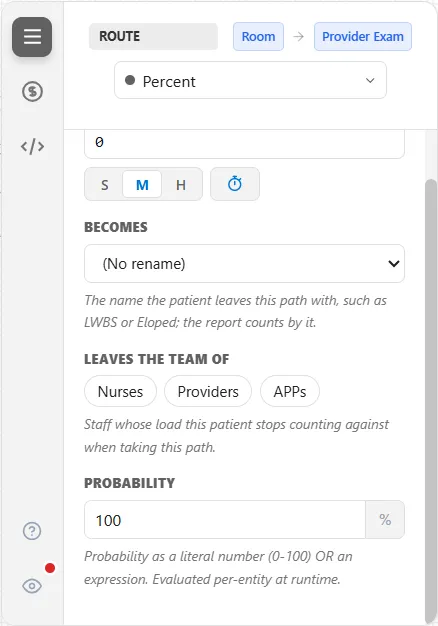
On a route of type Percent, Conditional, Alternate, Round Robin or Renege, Leaves the team of shows a chip for each resource that has a caseload, here Nurses, Providers and APPs. Choose a chip and the patient stops counting against that staff’s load on this route: “Staff whose load this patient stops counting against when taking this path.” When no resource has a caseload, the box says “No resource in this model has a caseload.”
The department’s words
Section titled “The department’s words”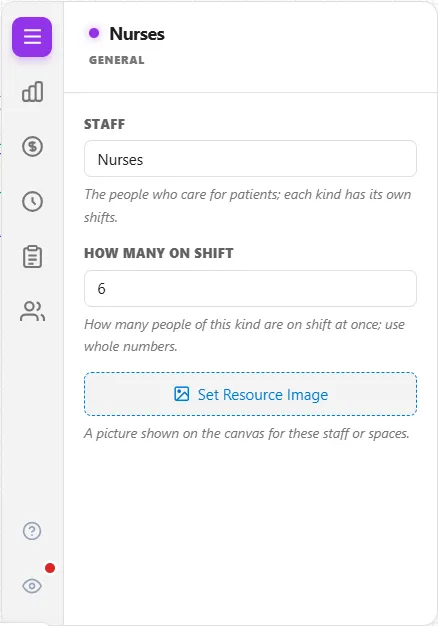
Each field below is the same setting as before, computed the same way, with a different label.
| General ProcessModel | With the Emergency Department lens |
|---|---|
| Entity | Patient |
| Activity name | Care step |
| Processing Time | Hands-on time |
| Capacity | Patients at once |
| Queue | Waiting area |
| Resource | Staff, or Spaces for a space |
| Quantity | How many on shift, or How many for a space |
| Shift schedule | Shifts, or Open hours for a space |
| Renege after | Walks out after |
| New Name | Becomes |
| Per-Entity Cost | Cost per patient |
| Hourly Cost | Cost an hour |
| Replications | Runs |
| Warmup length | Settle-in time |
How a visit ends
Section titled “How a visit ends”The report counts eight kinds of departure: Discharged, Admitted, Transferred out, Died in ED, LWBS, Eloped, AMA and Diverted. Diverted is not counted as a visit. Each is a patient type on the canvas, added with the first tile you place. A route gives the patient one of these names with Becomes: “The name the patient leaves this path with, such as LWBS or Eloped; the report counts by it.”