

Building a Fluid Model in ProcessModel
A step-by-step guide for someone who has never opened the product. Written against version 7.0.6478. Every number in it was measured on that build, and the model it builds, ships beside this document so you can open the finished article and compare.
What this guide covers
Section titled “What this guide covers”ProcessModel has two halves. One counts things: patients, orders, parts, people. The other measures them: gallons, liters, kilograms, pounds. This guide is about the second half, the fluid and bulk elements, and it assumes you have never used the product at all.
It is in five parts. Part 1 is the window and how to find things in it. Part 2 explains the idea the fluid elements are built on, which is worth ten minutes because almost every early mistake comes from carrying discrete habits into a plant that doesn’t work that way. Part 3 builds the first model from an empty canvas: a supply, three tanks, a delivery, four pipes. Part 4 reads what came back. Part 5 works through the rest of the dairy palette using the models that already ship with the product.
Part 1. Before you build anything
Section titled “Part 1. Before you build anything”1.1 The window
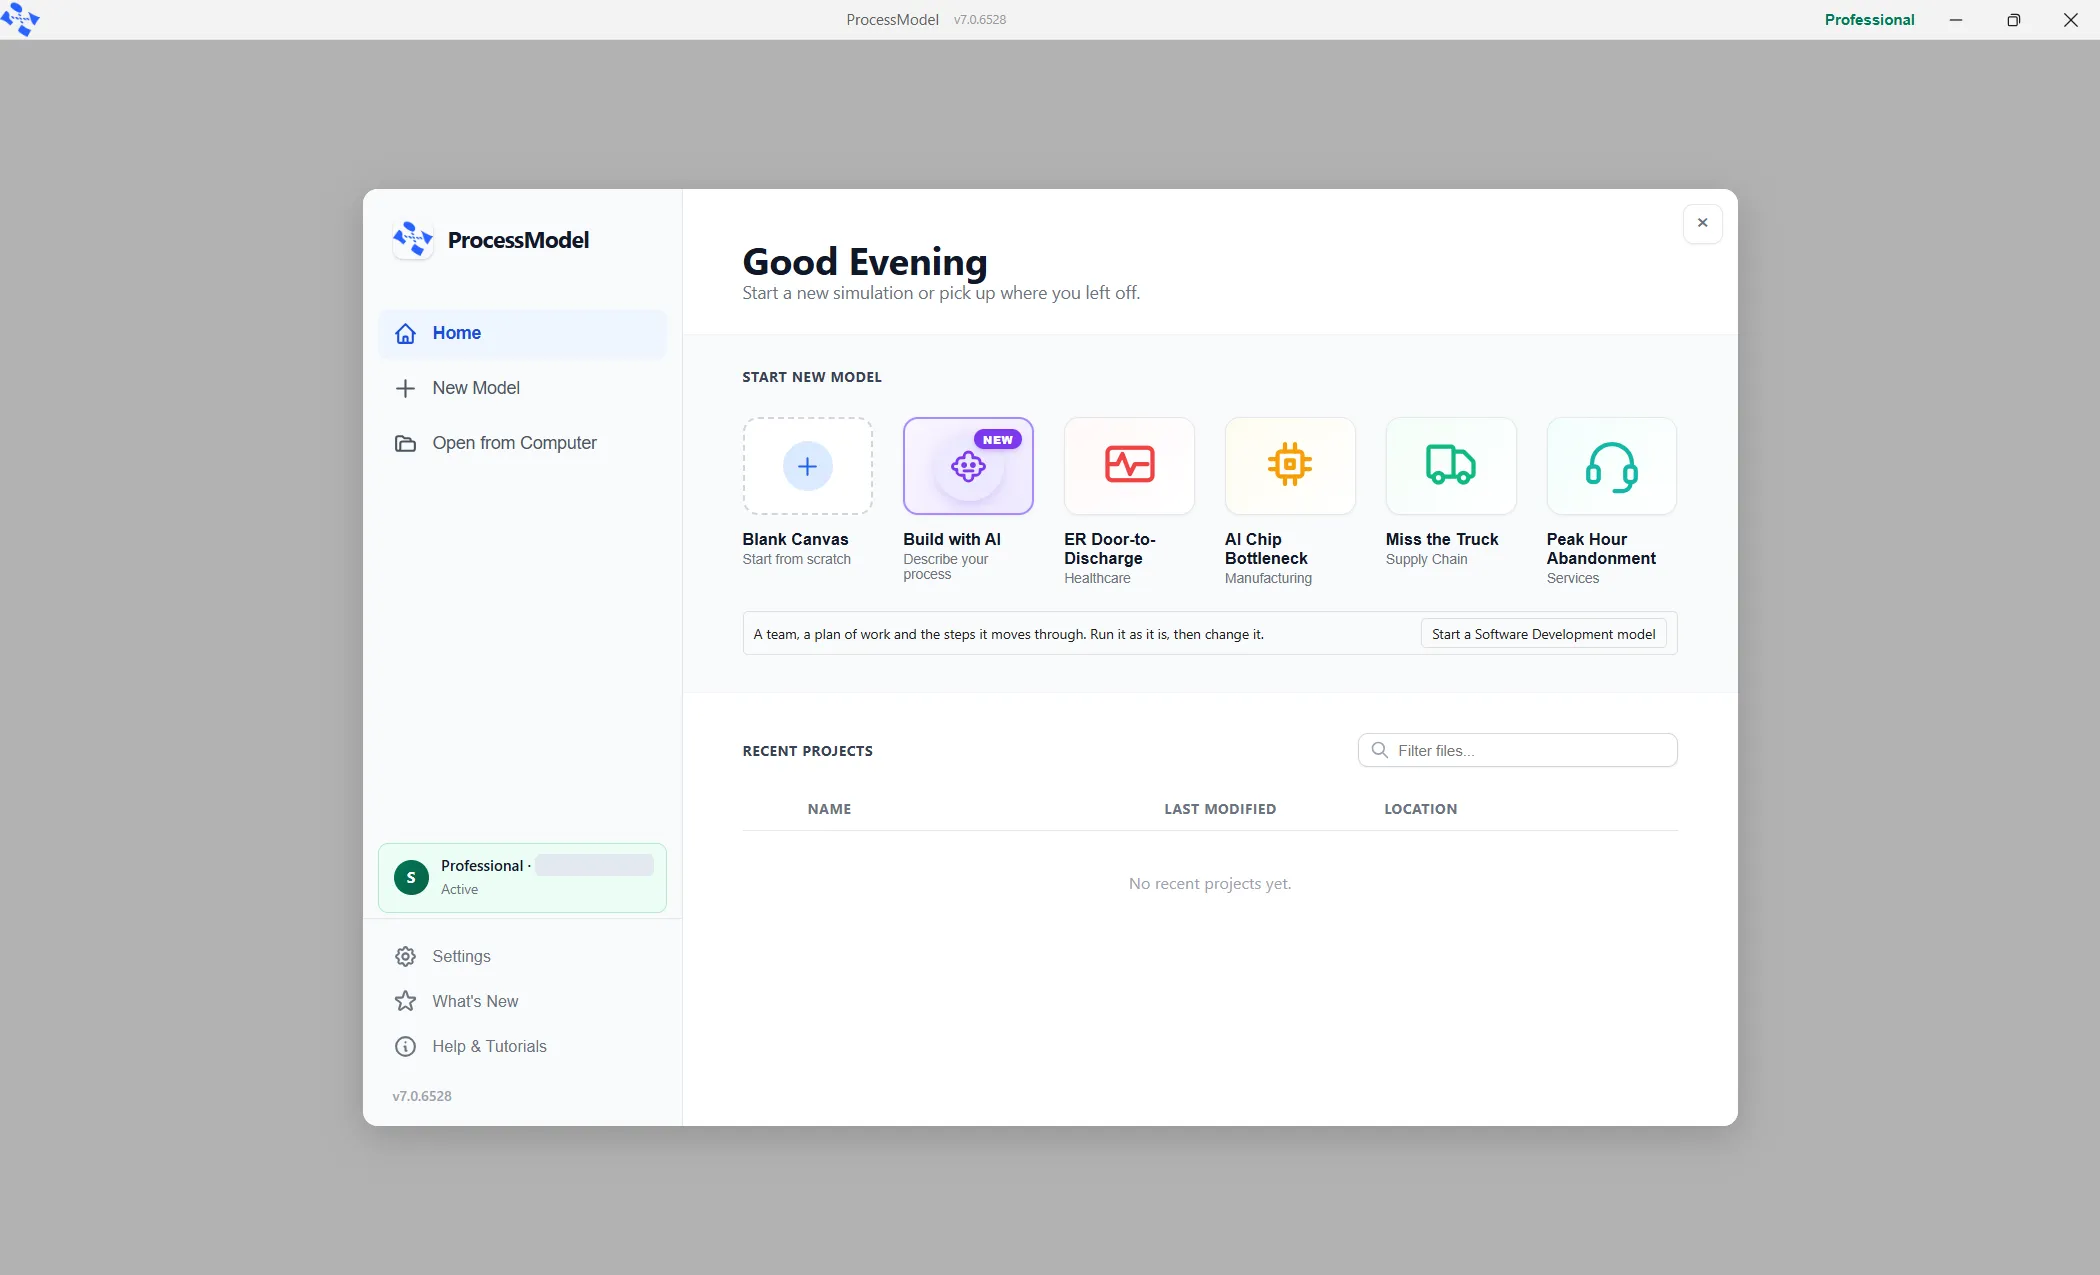
Section titled “1.1 The window”Start ProcessModel, and you get the welcome screen. It offers a blank canvas, a set of ready-made example models by industry, and a list of whatever you had open last.
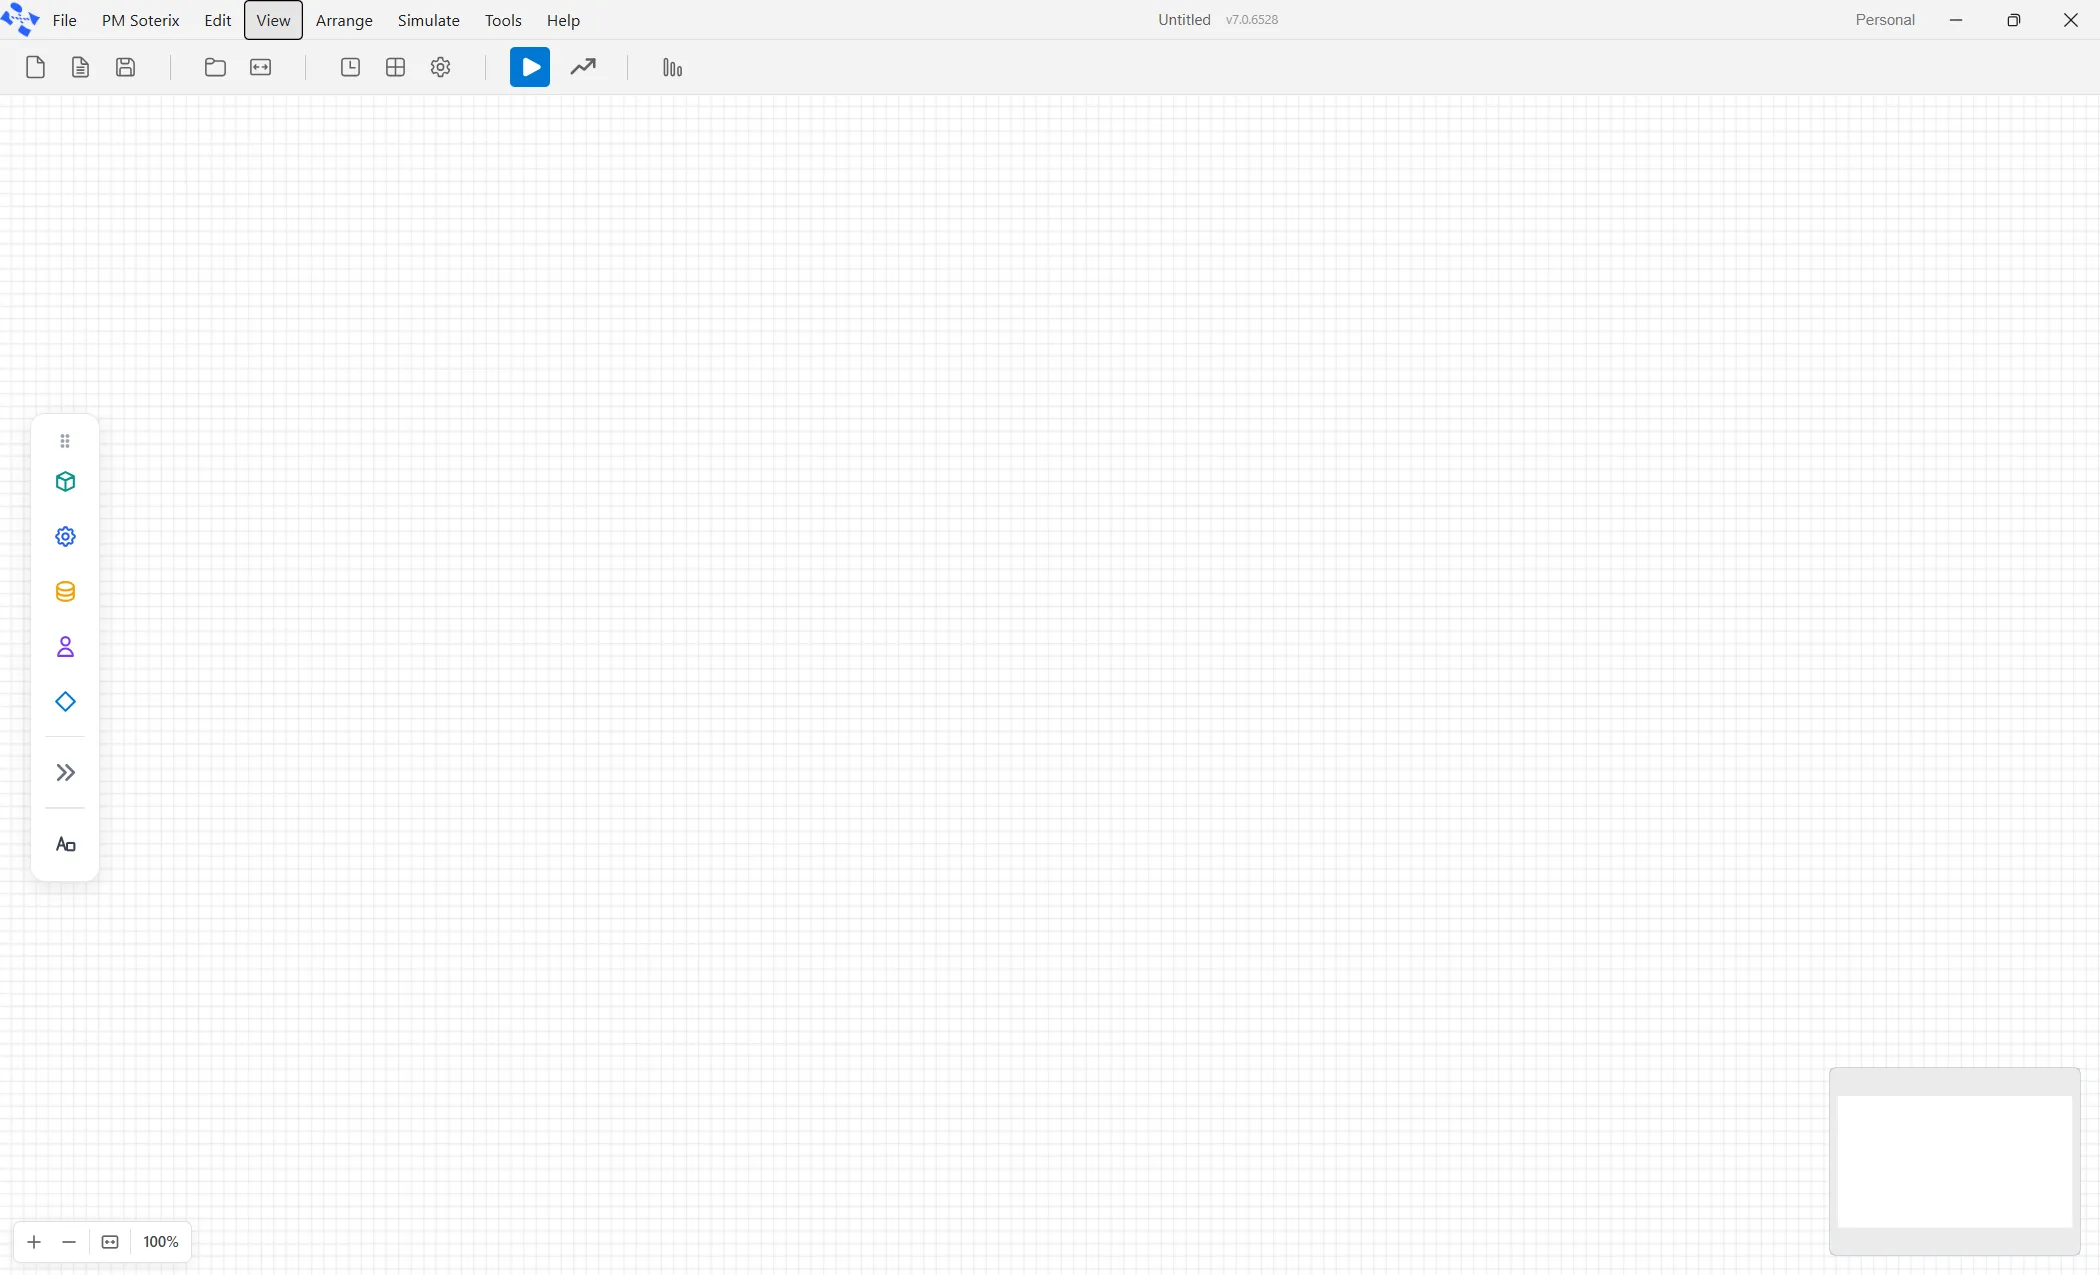
Choose Blank Canvas and you are in the modelling window. There are three things to find and everything else can wait.
The menu bar across the top: File, PM Soterix, Edit, View, Arrange, Simulate, Tools, Help.
The toolbar under it. The blue triangle runs the simulation. The icons to its left are New, Open, Save, and Simulation Settings.
The element palette floating on the left. These are the general-purpose elements: Entity, Activity, Queue, Resource, Decision, and a chevron that opens the advanced ones. The fluid elements are not here yet. Part 3 turns them on.
1.2 Five habits worth forming now
Section titled “1.2 Five habits worth forming now”Click an element once to see its settings. A single click opens a properties panel on the right. You do not need to double-click, and double-clicking will usually start renaming instead.
Read the grey text under each field. Every field in the fluid elements carries a sentence explaining what it does and what it accepts. Those sentences are the real reference, and they are more current than any document, this one included.
Name things the way the plant names them. Names are not decoration here. A pipe finds its tanks by name, and the commands that open and shut valves take a name in quotes. Rename a tank later, and you have to go and find everything that referred to it.
Leave a field blank rather than guessing. A made-up tank capacity produces a model that runs, reports, and answers a capacity question with a number nobody chooses. The product will stop you and ask rather than invent one, and that is the behavior you want.
Save early. Models are saved as .pmd files through File, Save.
1.3 Opening any model named in this guide
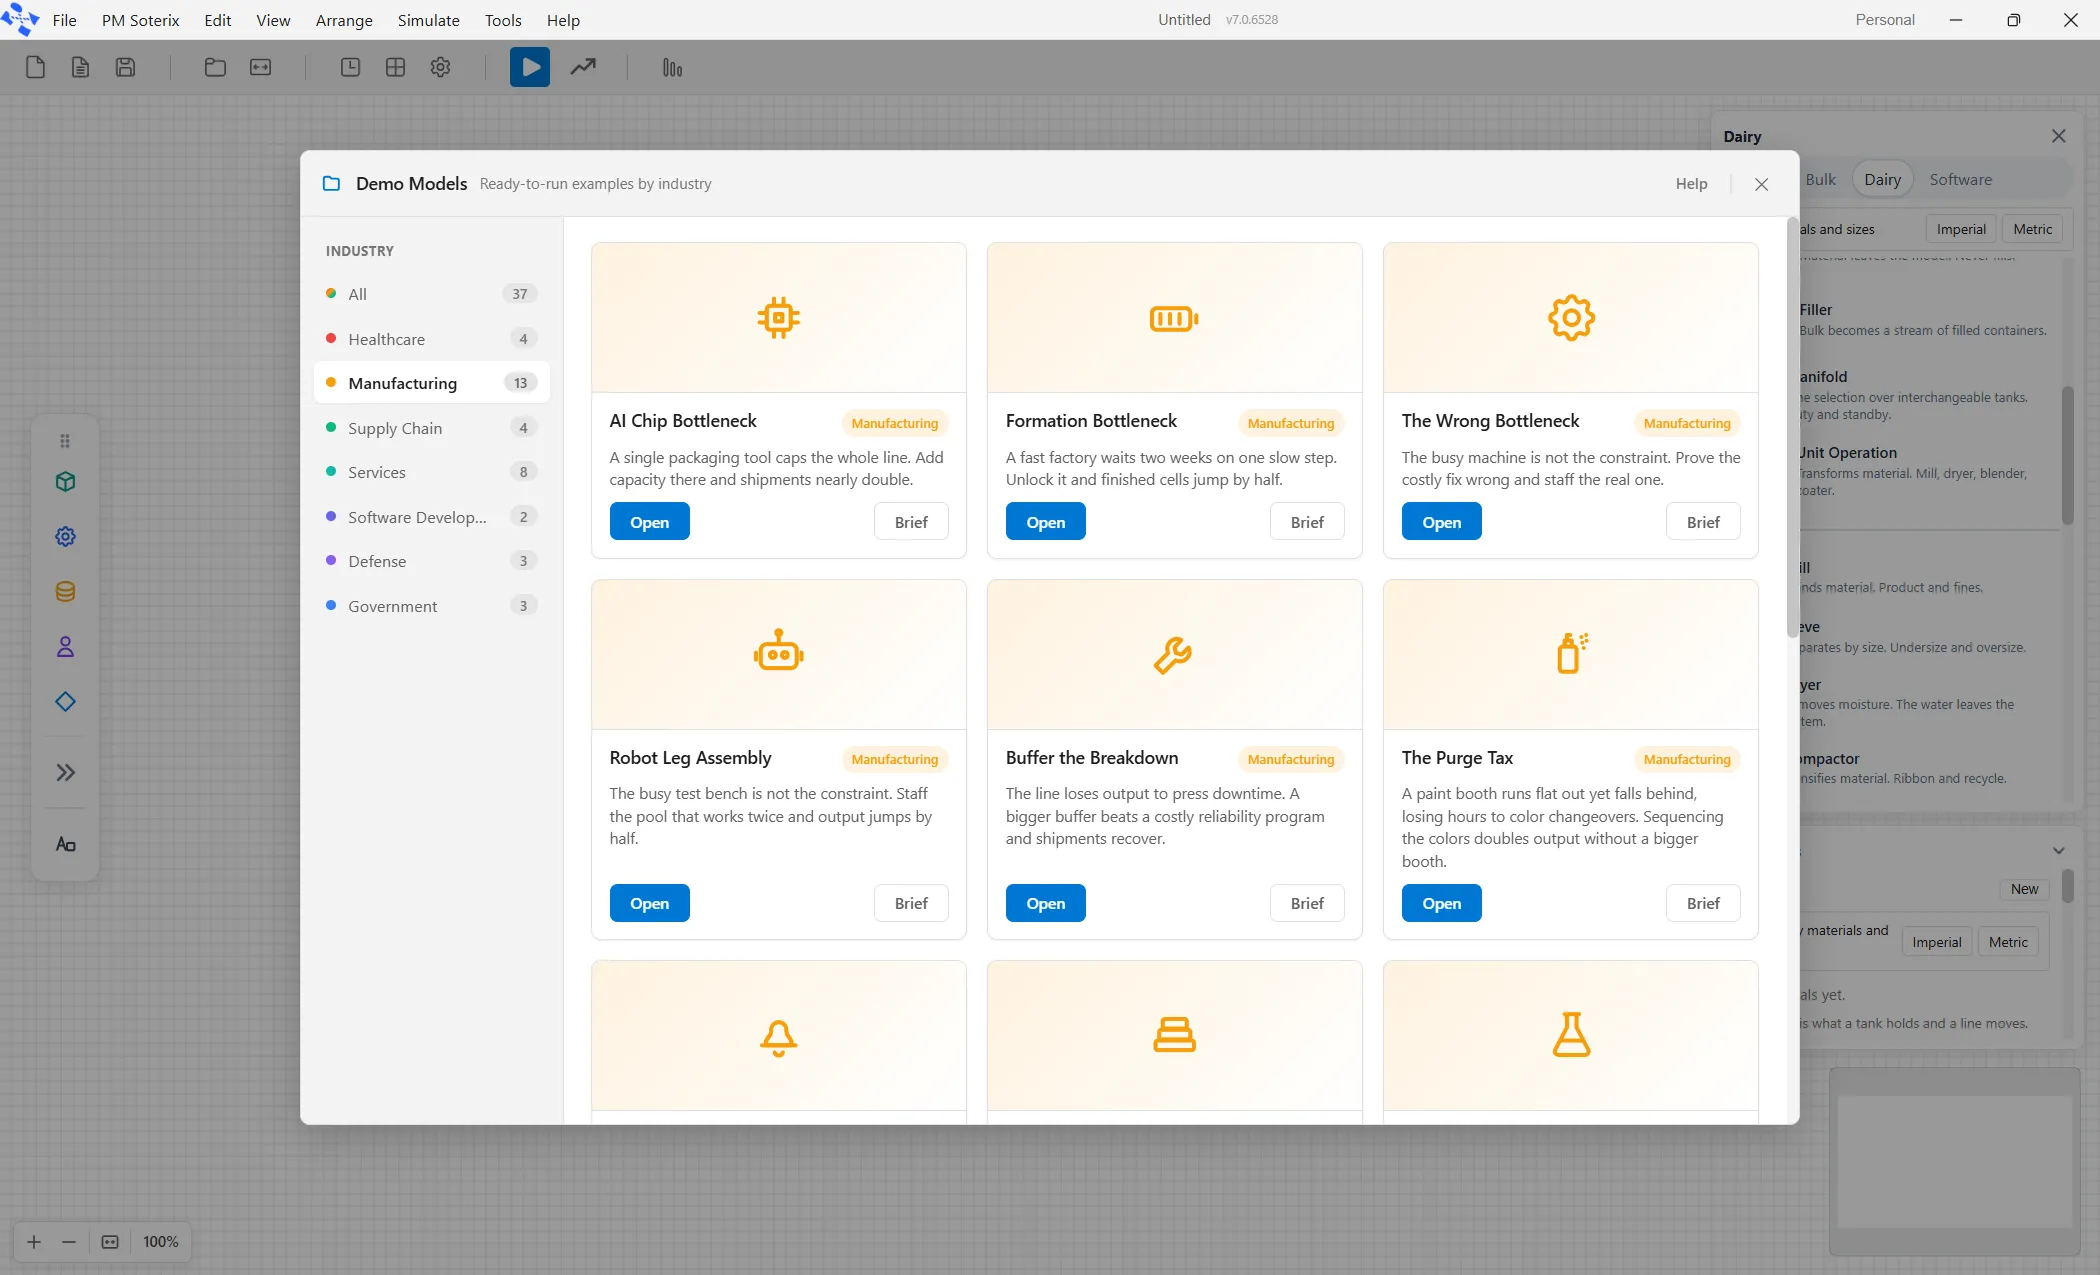
Section titled “1.3 Opening any model named in this guide”Part 5 works through five models that ship with the product. To open one, go to File, then Demo Models. A gallery opens with an industry list down the left side and a card for each model. Each card has two buttons: Open loads the model, and Brief shows the written case study.
Part 2. The viewpoint the fluid elements were built from
Section titled “Part 2. The viewpoint the fluid elements were built from”Ten minutes here saves a great deal of confusion later. The fluid elements are not skin over the discrete ones. They were built from a different starting idea, and the places where that idea shows up are exactly where new users get stuck.
2.1 Counted things and measured things
Section titled “2.1 Counted things and measured things”A discrete model moves things you can count. One patient, one order, one pallet. The model asks how many are here, how long each waited, and how many got through.
A plant that handles fluid does not work like that. Nobody counts the gallons in a silo. They read a level. Milk does not queue at a pump and get served one gallon at a time; it flows at a rate, and the rate is set by the pipe, not by how much is waiting. The question a plant asks is not how many are in the queue. It is how much is in there, how fast it is moving, and what is stopping it from moving faster.
So the fluid half of ProcessModel measures instead of counting. A vessel holds a level. A pipe moves a quantity per minute. There is no queue, there is no waiting line, and nothing takes a turn.
2.2 The two wire rule
Section titled “2.2 The two wire rule”This is the single most useful sentence in the guide, so it gets its own heading.
Almost every first fluid model that draws and then does nothing has an ordinary routing arrow where a pipe should be. The model looks finished. It runs. It reports. It moves no material at all, because no routing arrow has ever moved material and none ever will.
Where the two halves meet, there are three converter elements, and only three. A Discharge turns a tank of material into one entity carrying its own quantity. A Filler turns a tank of material into a stream of filled containers. A Dumper goes the other way and empties an arriving entity into a tank. Outside those three, the two halves do not touch.
2.3 A tank is a level, not a queue
Section titled “2.3 A tank is a level, not a queue”A vessel has a working capacity and, if you want one, a heel. The heel is what you can’t pump out: the material below the outlet that stays in the bottom. A vessel sitting at its heel is empty for every practical purpose, and the report says so in a column called % Time At Heel rather than calling it empty, because the two are not the same thing and the difference is real money in a plant.
A vessel can also carry up to four level marks, named LL, L, H and HH, at whatever level you choose. Crossing one can stop an inflow, or run a line of logic, which is how a high switch that shuts a fill valve is modeled.
2.4 What the fluid elements deliberately do not model
Section titled “2.4 What the fluid elements deliberately do not model”This matters more than it sounds, because a model that quietly implies something it never simulated is worse than one that refuses. Four limits are worth knowing before you design anything.
No temperature, and no chemistry. Nothing in the run reads a temperature. Heating, cooling and holding are expressed as a rate and a time. When a model shows a vat going from 4 degrees to 63, those numbers are inputs to a duration calculation and nothing else. The model answers how long the vat is busy. It does not answer whether the jacket gets there.
No pressure, pH, concentration, viscosity or fat percentage. A separator splitting cream from skim does it by a fixed ratio you supply, not by simulating anything.
Quantities on the fluid elements are plain numbers. A tank capacity, an initial level, a heel, a level mark, a pipe rate: all of these take a literal number only. They will not accept a variable, an attribute or a distribution. The product says so in the field help itself, which is worth noting because most other quantity fields in the product do accept expressions. Wash durations, changeover times and breakdown times do accept expressions; the quantities above do not.
A pipe connects two vessels. It cannot start or end at an activity. Entities move on routes; material moves on pipes.
2.5 The ten things you can draw
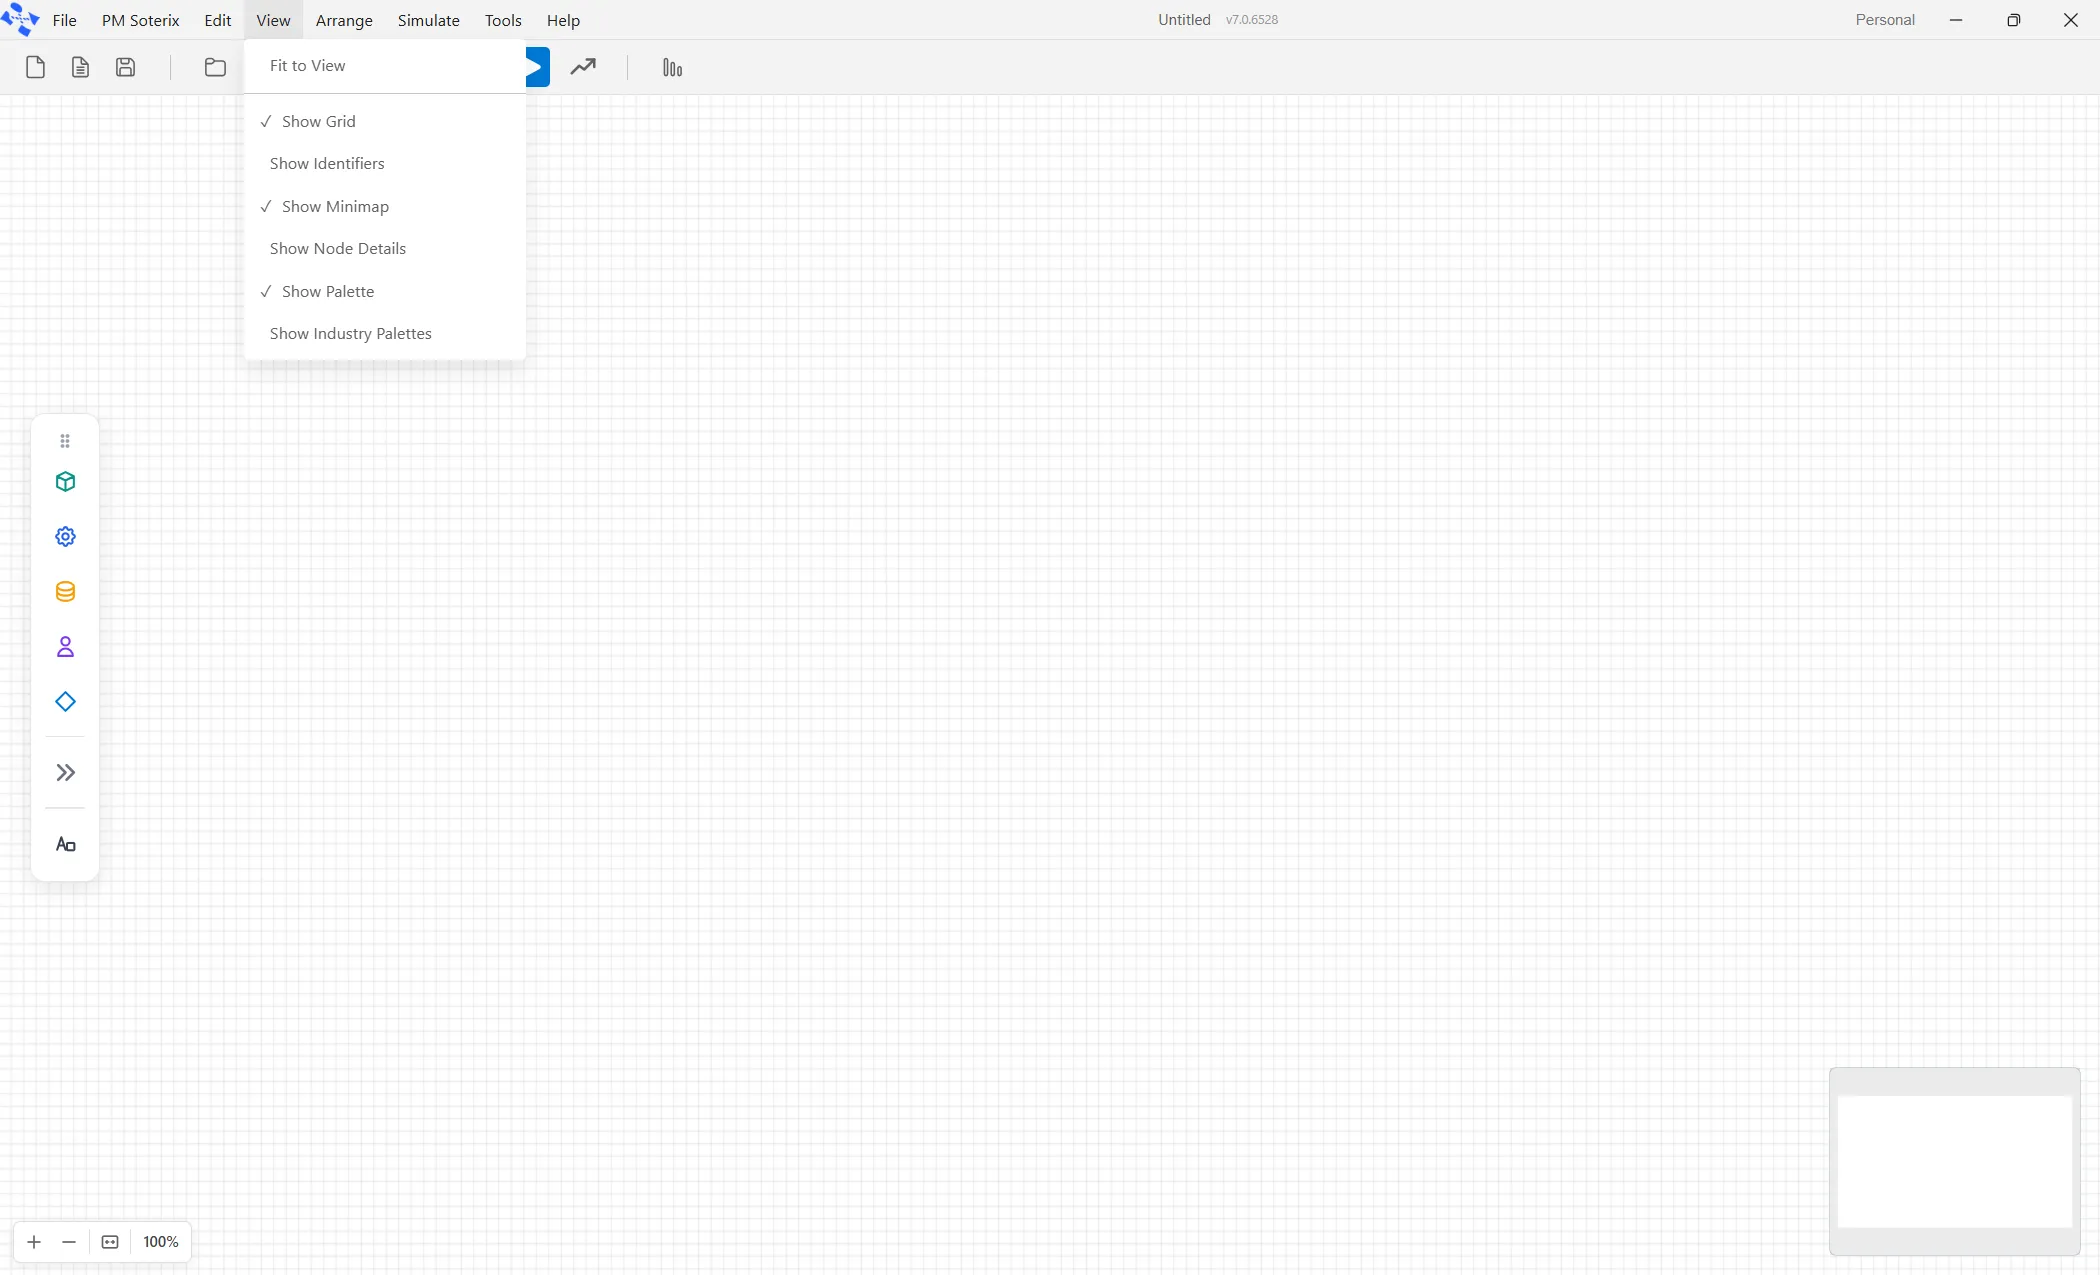
Section titled “2.5 The ten things you can draw”Turn the fluid elements on with View, then Show Industry Palettes. A panel opens on the right with four faces across the top: Fluids, Bulk, Dairy and Software. Choose Dairy.
The Dairy face is a curated selection, not a separate set of elements. Drop a Raw Silo and the model contains an ordinary vessel that happens to arrive already sized for a dairy. Nothing on this face is unavailable elsewhere, and a model built on it will open in a copy of the product that has never shown the Dairy face at all.
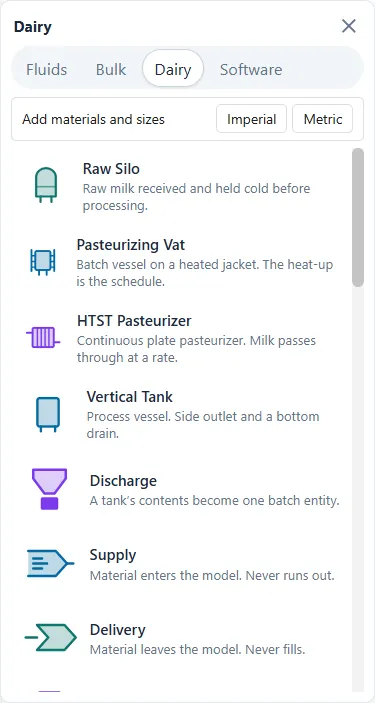
| Tile | What it is |
|---|---|
| Raw Silo | A vessel, arriving sized for raw milk received and held cold. |
| Pasteurizing Vat | A vessel with a heated jacket. The heat up time is the schedule. |
| HTST Pasteurizer | A machine milk passes through at a rate. |
| Vertical Tank | A plain process vessel with a side outlet and a bottom drain. |
| Discharge | Turns a tank of material into one batch entity. |
| Supply | Material enters the model here. It never runs out. |
| Delivery | Material leaves the model here. It never fills. |
| Filler | Turns bulk into a stream of filled containers. |
| Manifold | One selection over several interchangeable tanks. Duty and standby. |
| Unit Operation | A machine that transforms material between tanks. |
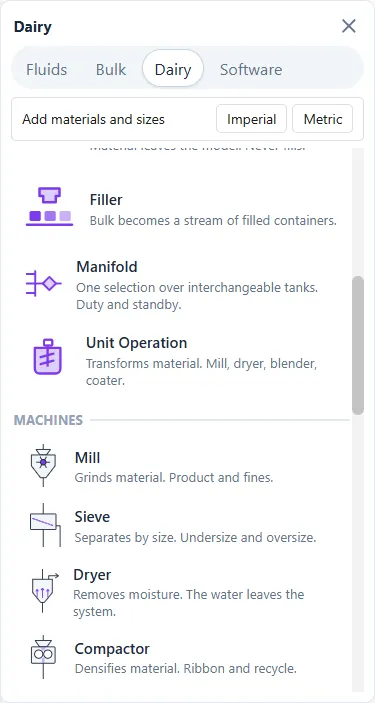
Below those ten the panel carries a Machines section. These are Unit Operations arriving preconfigured for a job: Separator, Pasteurizer, Homogenizer, Holding Tube, Cooler, Deaerator, In-Line Blender, Evaporator, Filter, Boiler and a dozen more. They are all the same element wearing different defaults.
Part 3. Your first model
Section titled “Part 3. Your first model”A supply, three tanks, a delivery and four pipes. About fifteen minutes from an empty canvas, and it teaches the one thing every fluid model is about.
3.1 What we are building
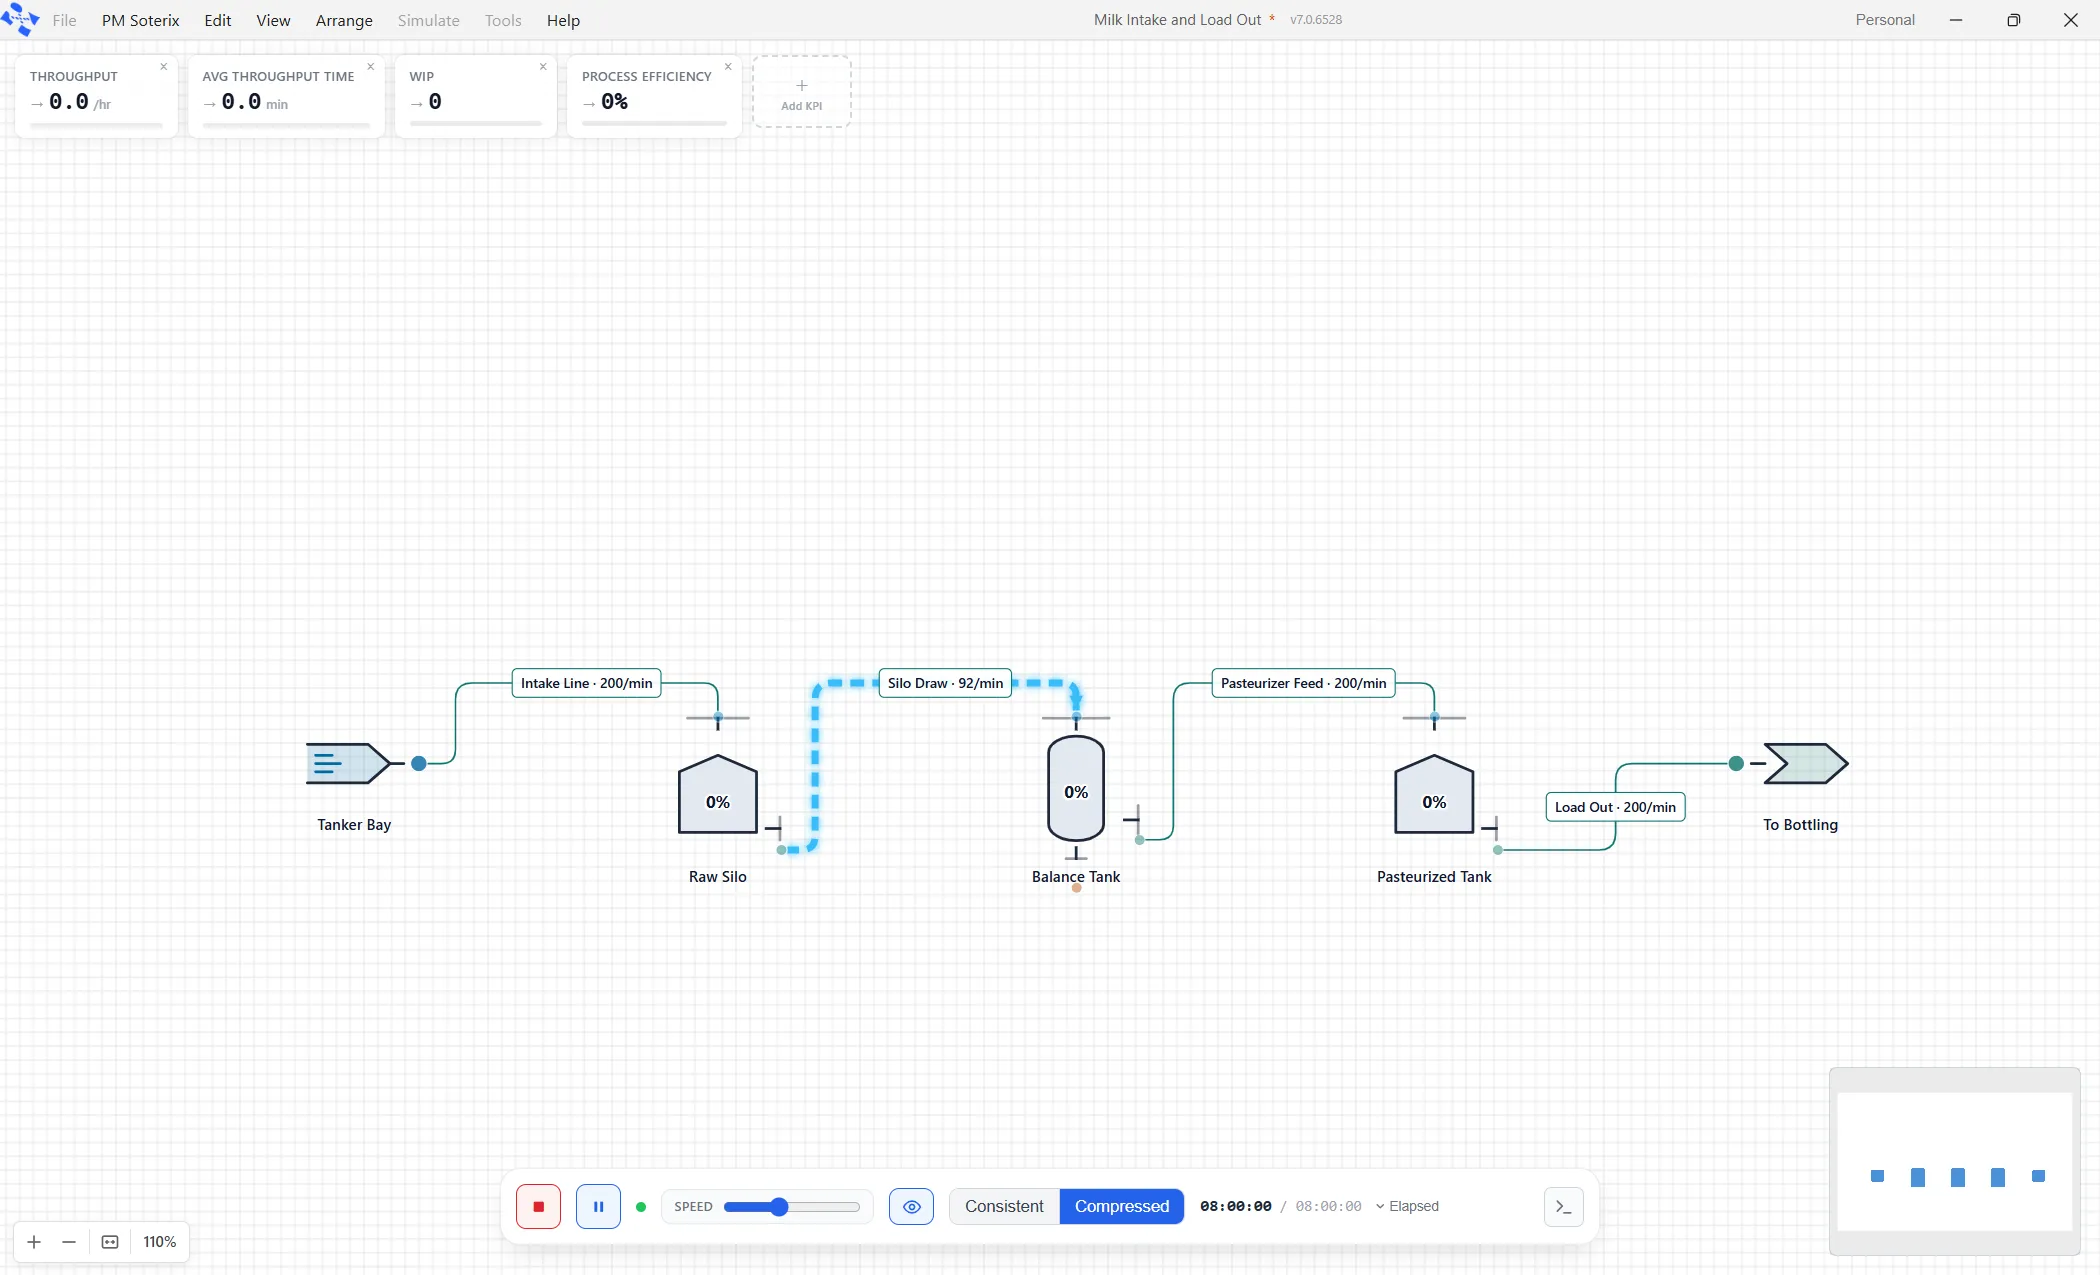
Section titled “3.1 What we are building”A small dairy takes milk in from road tankers, holds it in a raw silo, runs it through pasteurization, holds the pasteurized milk, and sends it to bottling. Written as a chain:
Tanker Bay to Raw Silo to Balance Tank to Pasteurized Tank to Bottling.
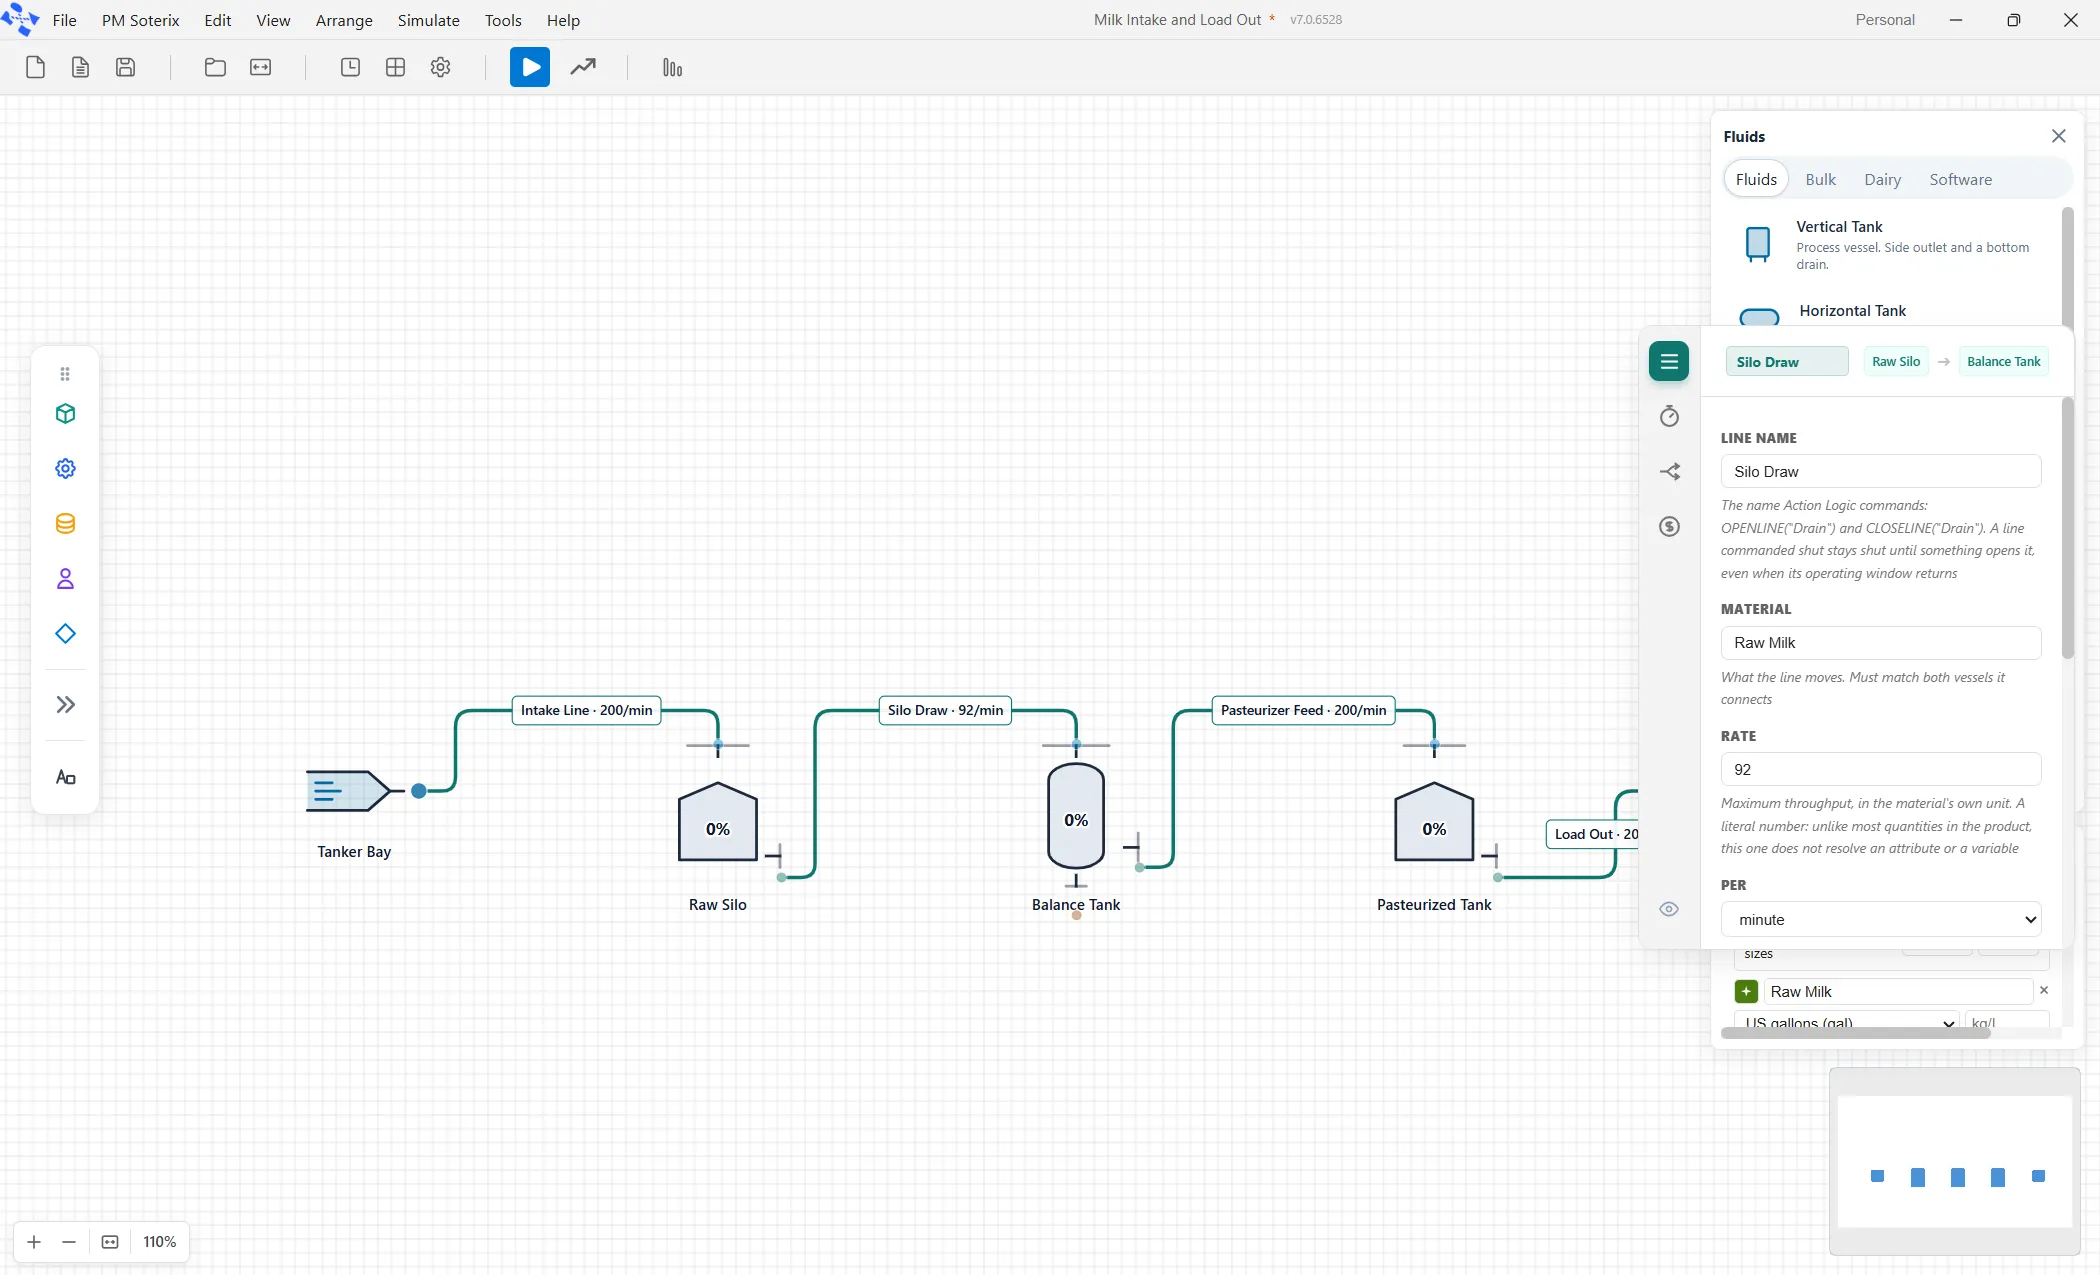
Three of the four pipes are rated 200 gallons a minute, which is roughly what the discharge pump on a road tanker does. One pipe, the Silo Draw, is rated 92, because that is a 5,500 gallon an hour plate pasteurizer divided by sixty. That gap is not a trick. It is the ordinary fact that a dairy receives milk far faster than it can process it.
There are no breakdowns, no shifts, no washes, no prices and no distributions anywhere in this model. That is deliberate. With nothing random in it, your run will produce exactly the numbers printed in Part 4, and a first model you can check is worth more than a realistic one you cannot.
3.2 Step one: turn on the fluid elements
Section titled “3.2 Step one: turn on the fluid elements”From the menu bar, choose View, then Show Industry Palettes. In the panel that opens on the right, click the Dairy tab.
3.3 Step two: declare the material
Section titled “3.3 Step two: declare the material”Everything in a fluid model is measured in the unit of the material it handles, so the material comes first. With the industry palette open, a Definitions panel appears on the right. The top section of it is Materials.
Click New beside Materials.
Type the name. For this model, Raw Milk.
Choose the unit from the dropdown: US gallons (gal).
That is all this model needs. The other boxes, density, value and cost per gallon, and specific heat, are for models that weigh things, price things or heat things. Leave them empty.
3.4 Step three: place the five elements
Section titled “3.4 Step three: place the five elements”Drag these from the Dairy palette onto the canvas, left to right:
| Drag this tile | Rename it to | Why |
|---|---|---|
| Supply | Tanker Bay | Milk enters the model here. Tankers arrive all day and we are not modelling them. |
| Raw Silo | Raw Silo | Where received milk is held. |
| Vertical Tank | Balance Tank | The small vessel feeding the pasteurizer. |
| Raw Silo | Pasteurized Tank | Where finished milk waits for bottling. |
| Delivery | To Bottling | Milk leaves the model here. Bottling is somebody else’s question today. |
To rename one, click it once and edit the Tank Name box at the top of the panel that opens on the right.
3.5 Step four: size the three tanks
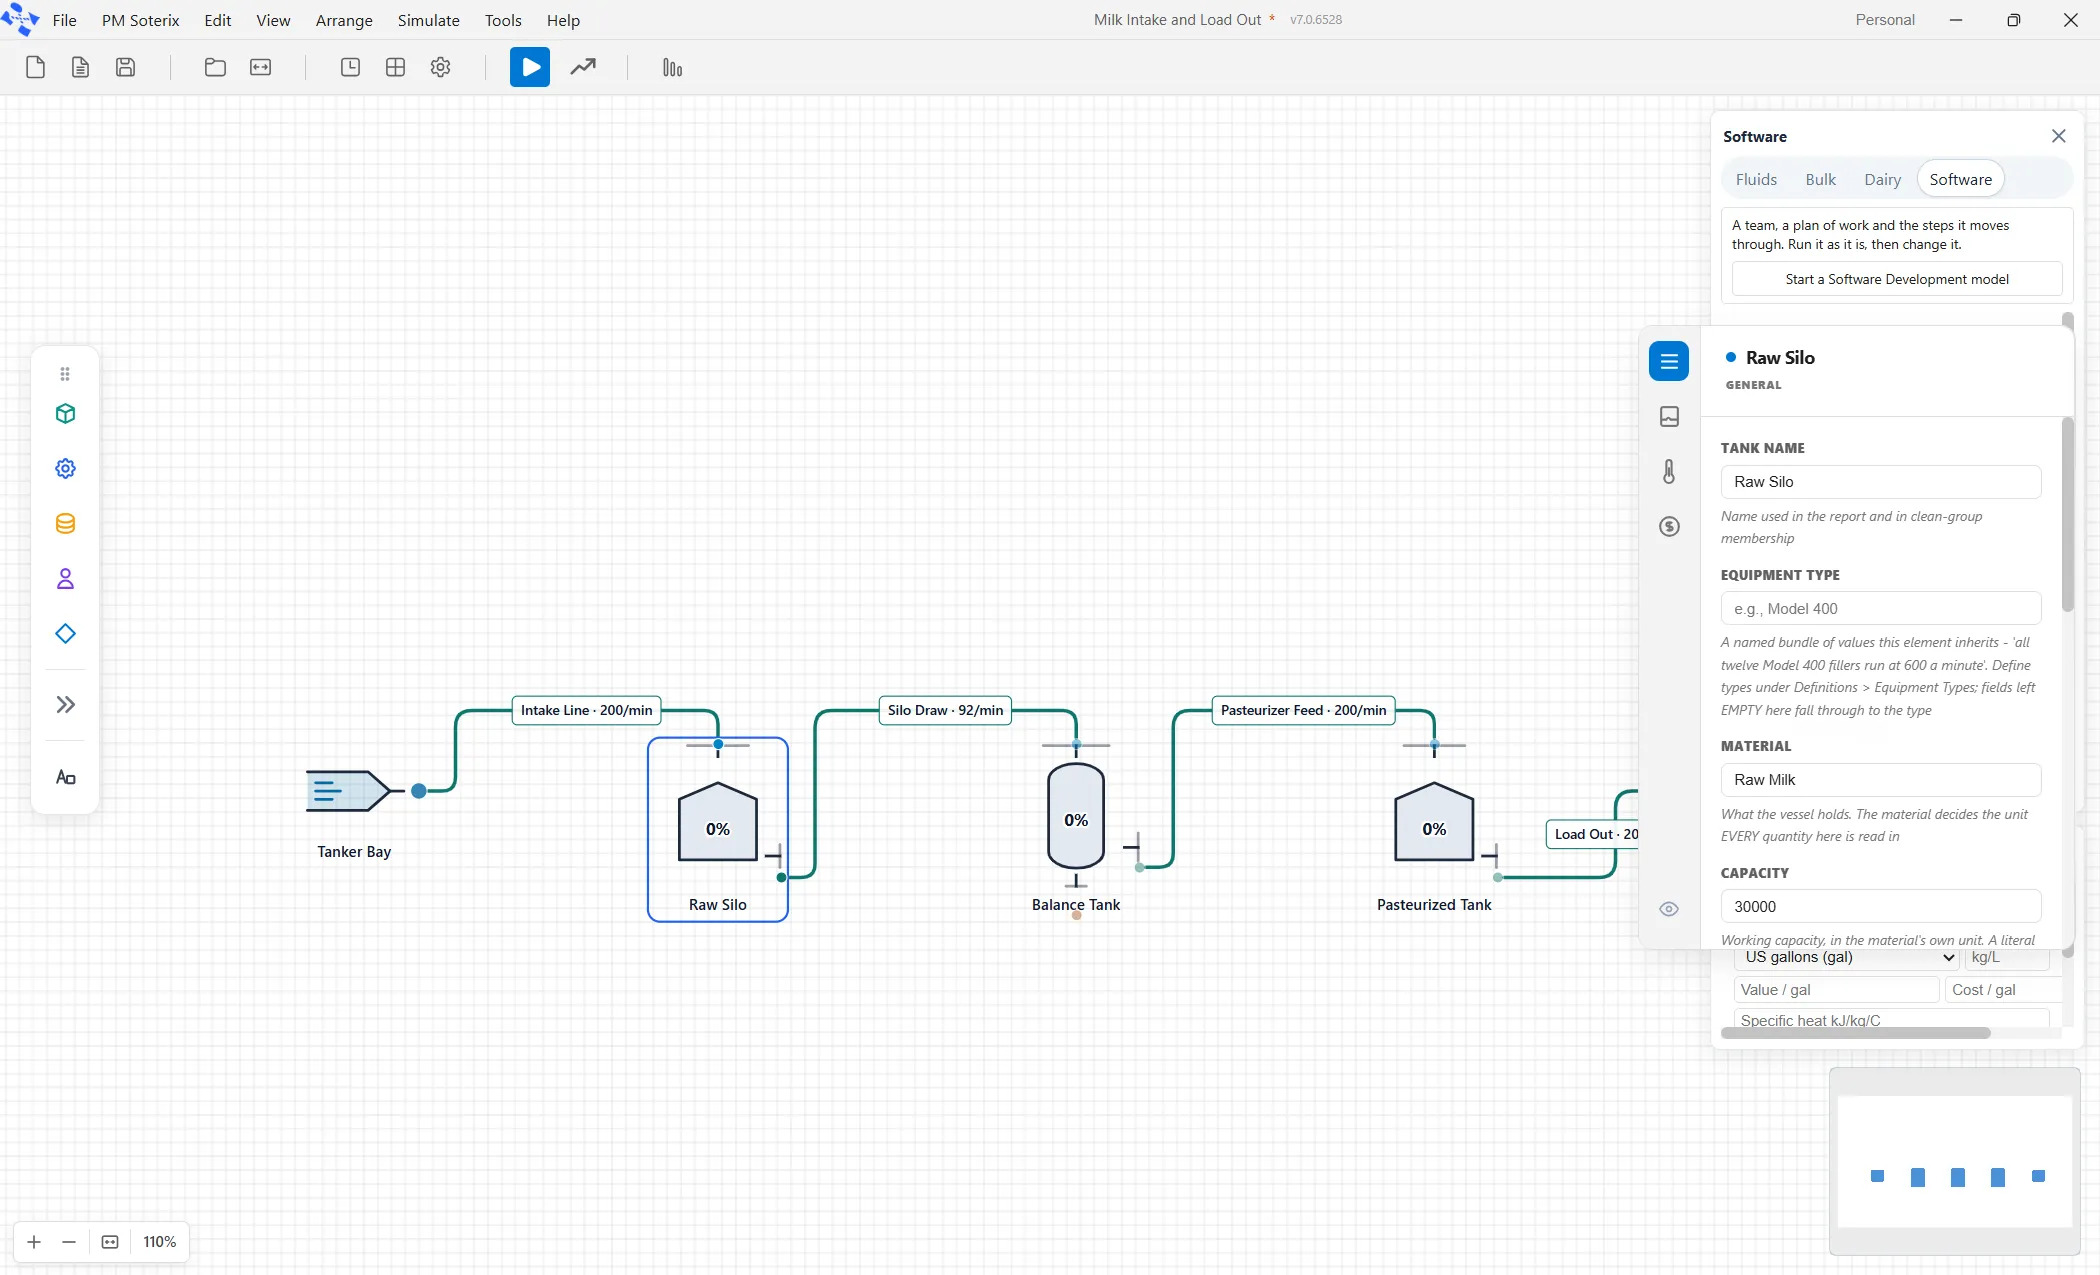
Section titled “3.5 Step four: size the three tanks”Click each tank in turn and fill in three boxes on the panel.
| Tank | Capacity | Starting Level | Heel |
|---|---|---|---|
| Raw Silo | 30000 | 0 | 0 |
| Balance Tank | 1000 | 0 | 0 |
| Pasteurized Tank | 10000 | 0 | 0 |
Also set Material to Raw Milk on all three. The plant starts the shift empty, so every starting level is zero, and no vessel in this model has an unpumpable bottom, so every heel is zero.
3.6 Step five: draw the four pipes
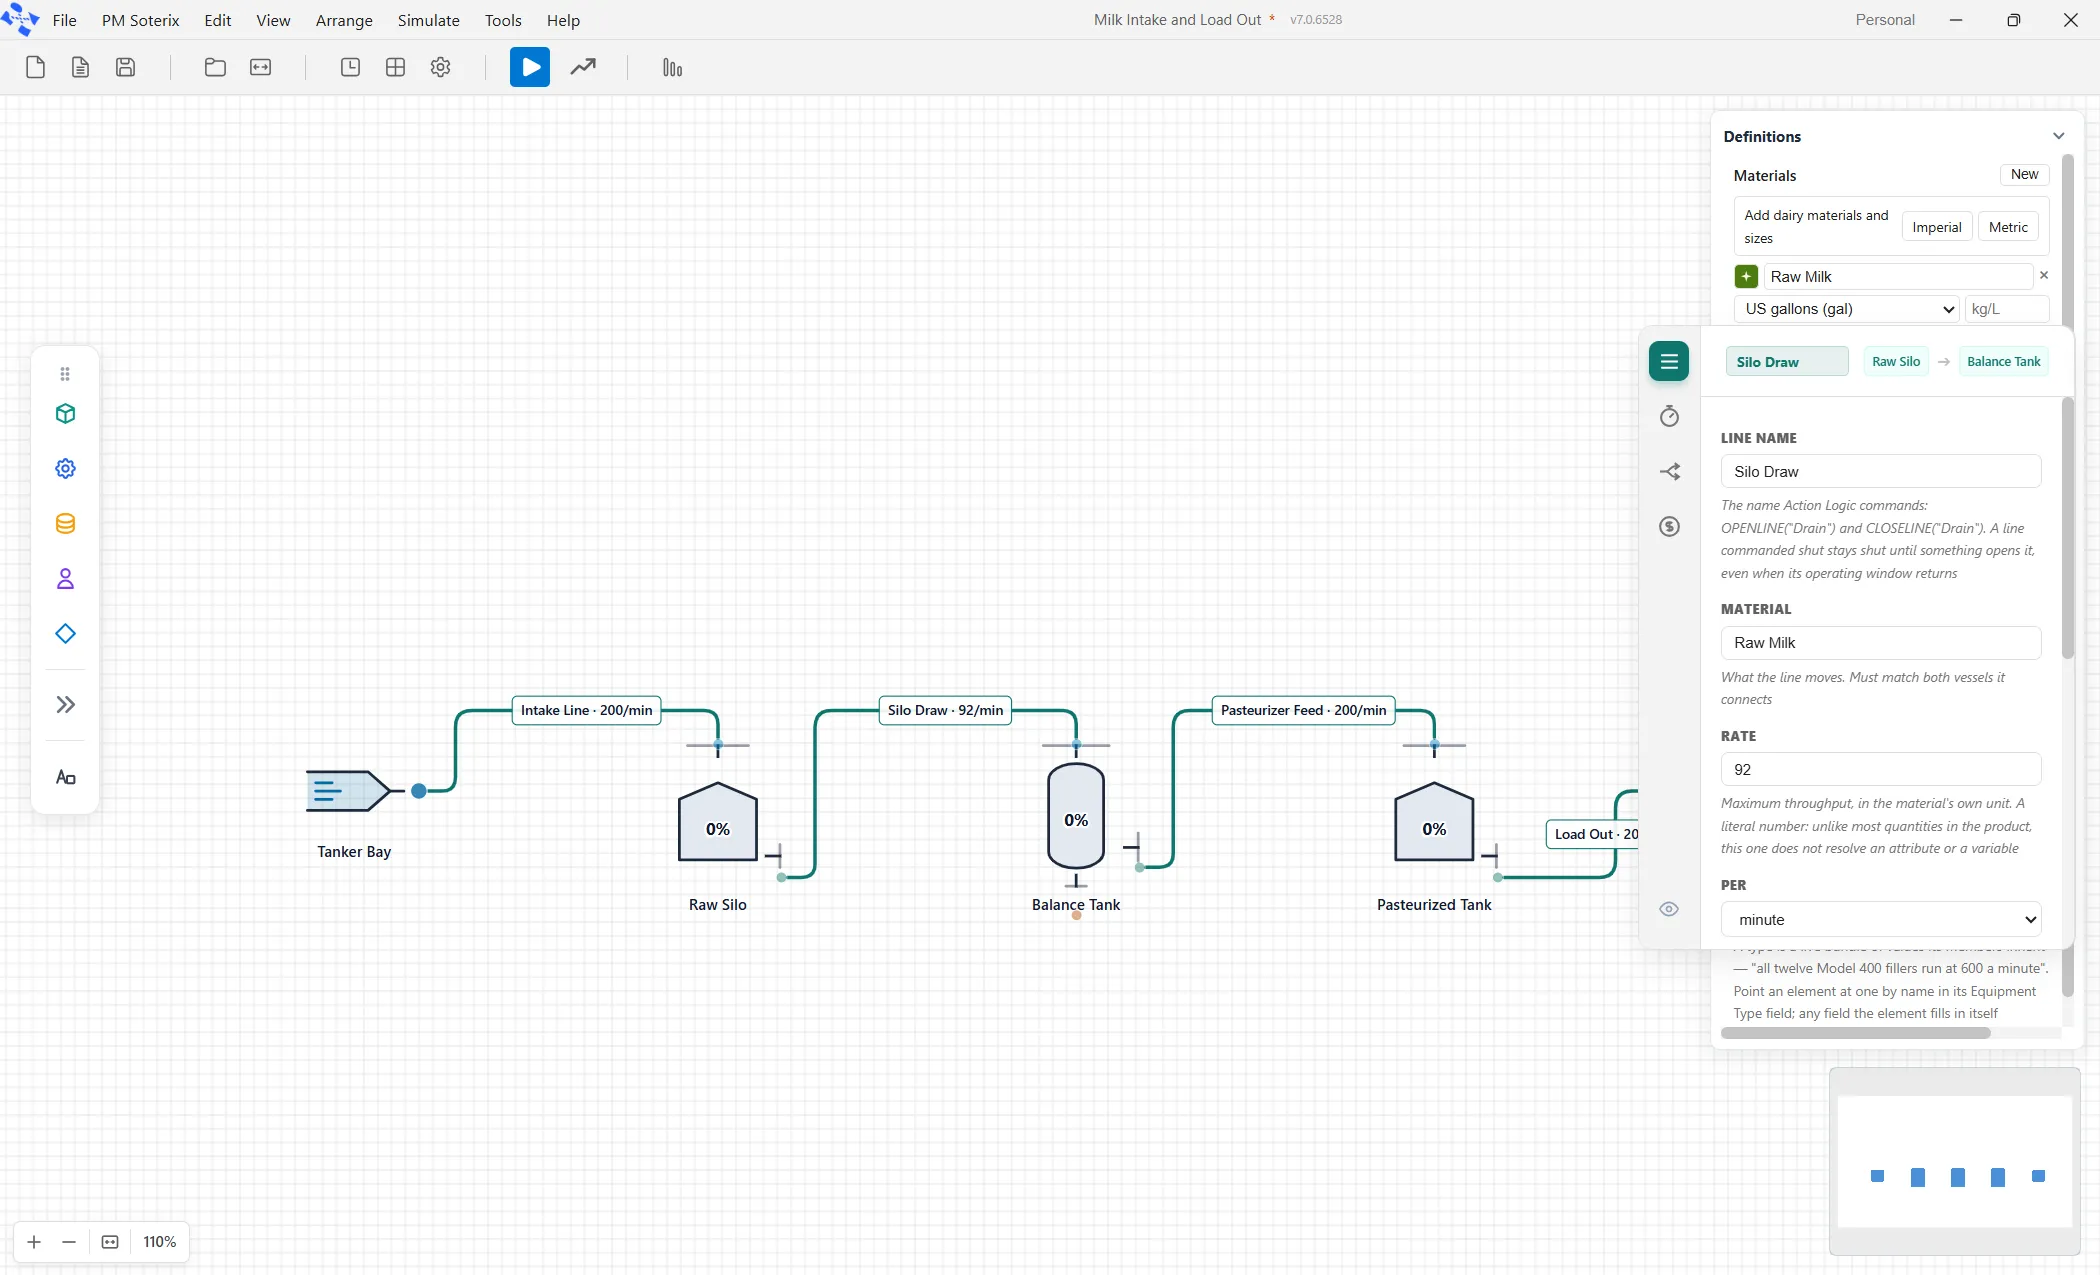
Section titled “3.6 Step five: draw the four pipes”A pipe is drawn like any connection: hover over the edge of one element until a handle appears, then drag from that handle to the element you want to connect to. Because both ends are vessels or boundaries, the product makes a transfer line rather than a route.
Click each new pipe once and fill in three boxes: the Line Name, the Material, and the Rate with its Per unit.
| Line Name | From | To | Rate | Per |
|---|---|---|---|---|
| Intake Line | Tanker Bay | Raw Silo | 200 | minute |
| Silo Draw | Raw Silo | Balance Tank | 92 | minute |
| Pasteurizer Feed | Balance Tank | Pasteurized Tank | 200 | minute |
| Load Out | Pasteurized Tank | To Bottling | 200 | minute |
3.7 Step six: set the run length
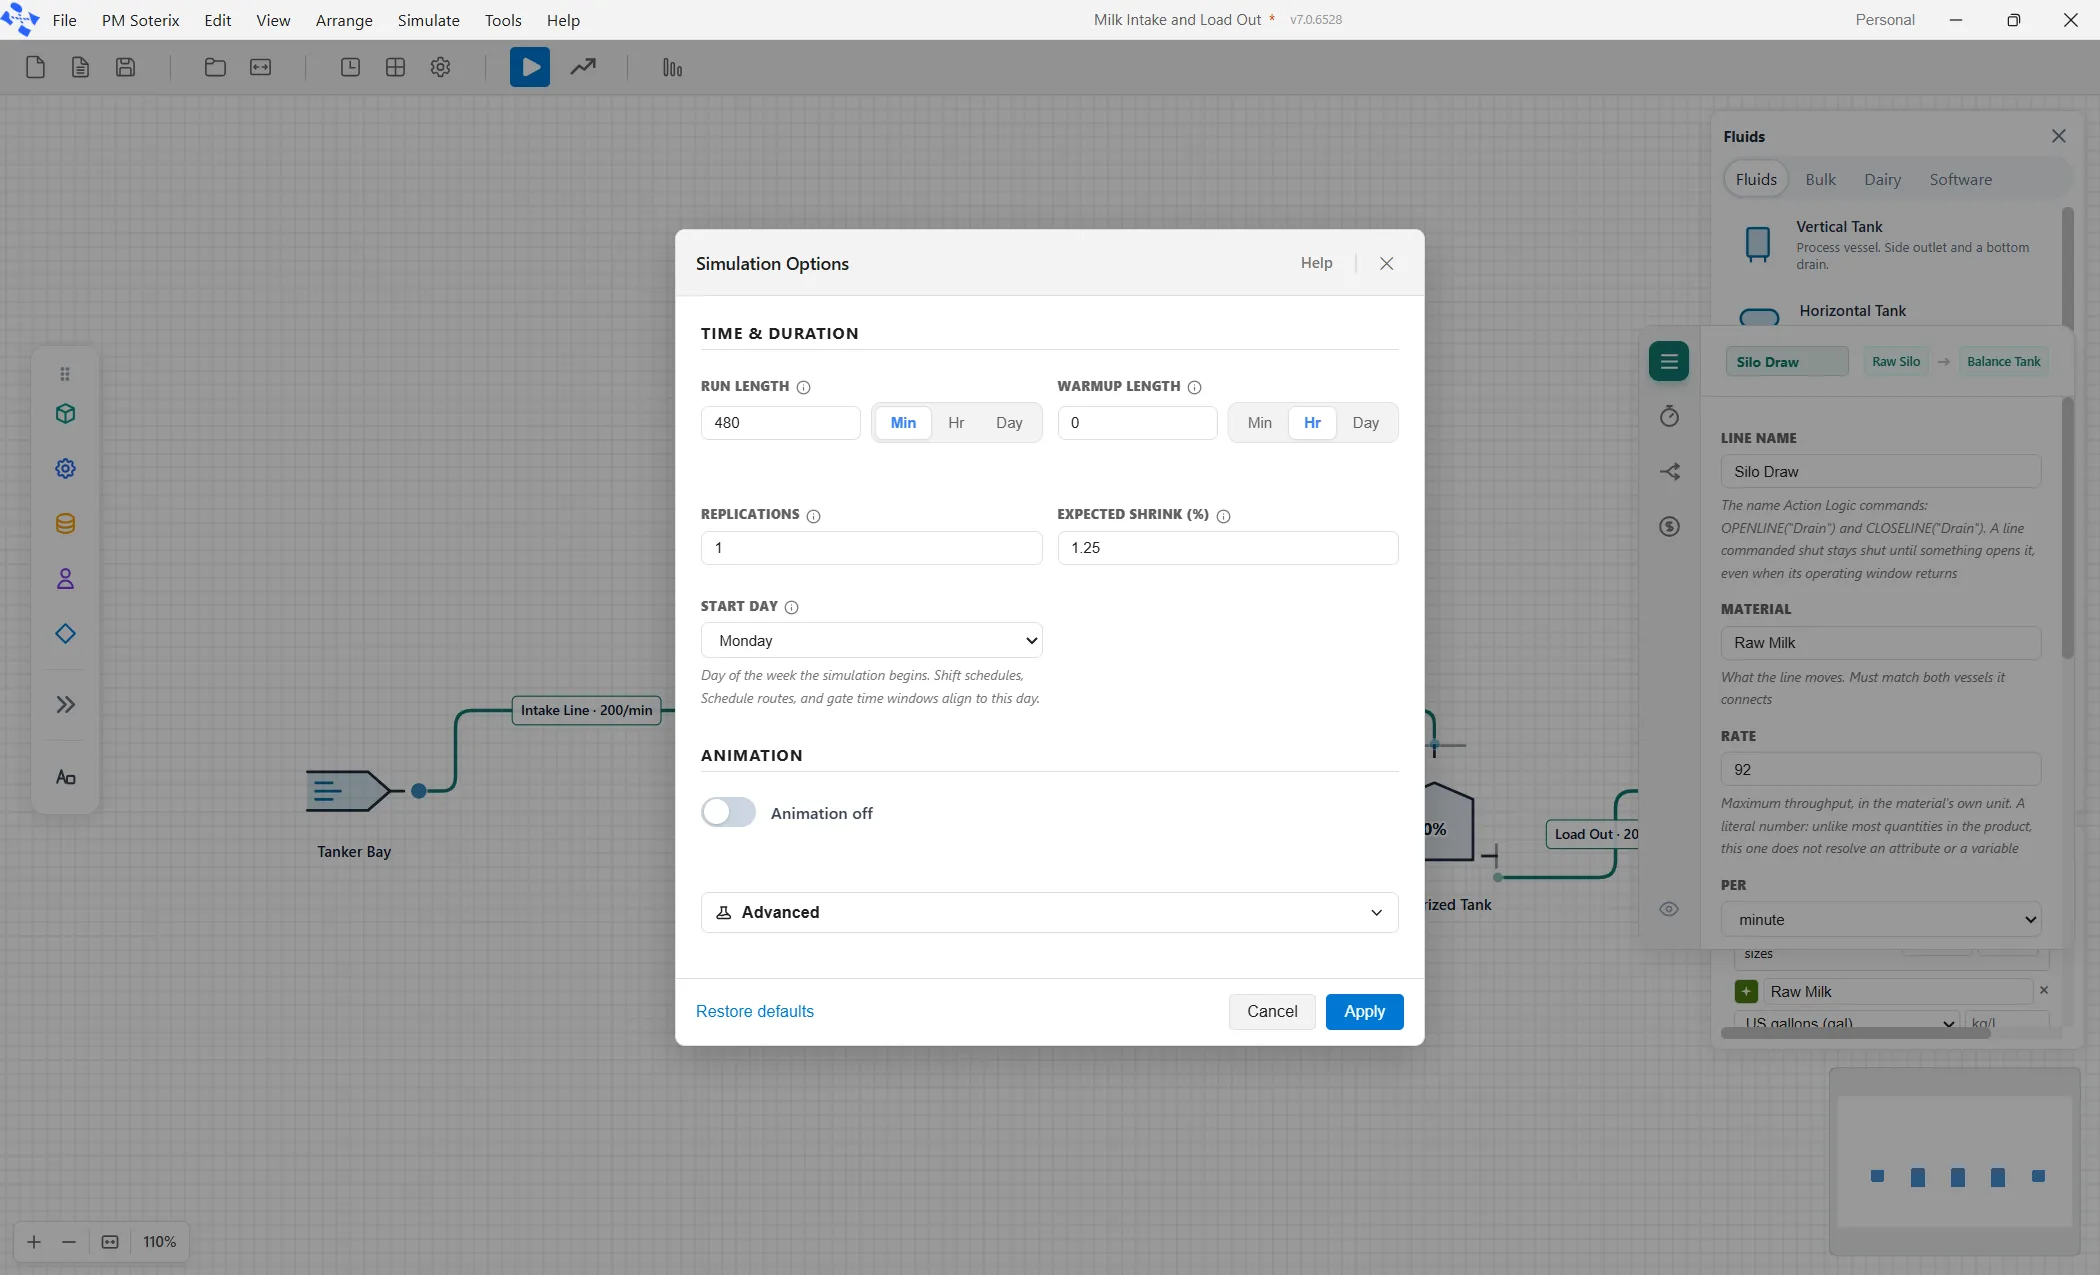
Section titled “3.7 Step six: set the run length”Choose Simulate, then Options. Set Run length to 480 and the unit beside it to Min, which is one eight hour shift. Leave Warmup length at 0 and Replications at 1. Turn Animation off, which makes the run finish in about a second instead of playing out on the canvas. Click Apply.
3.8 Step seven: run it
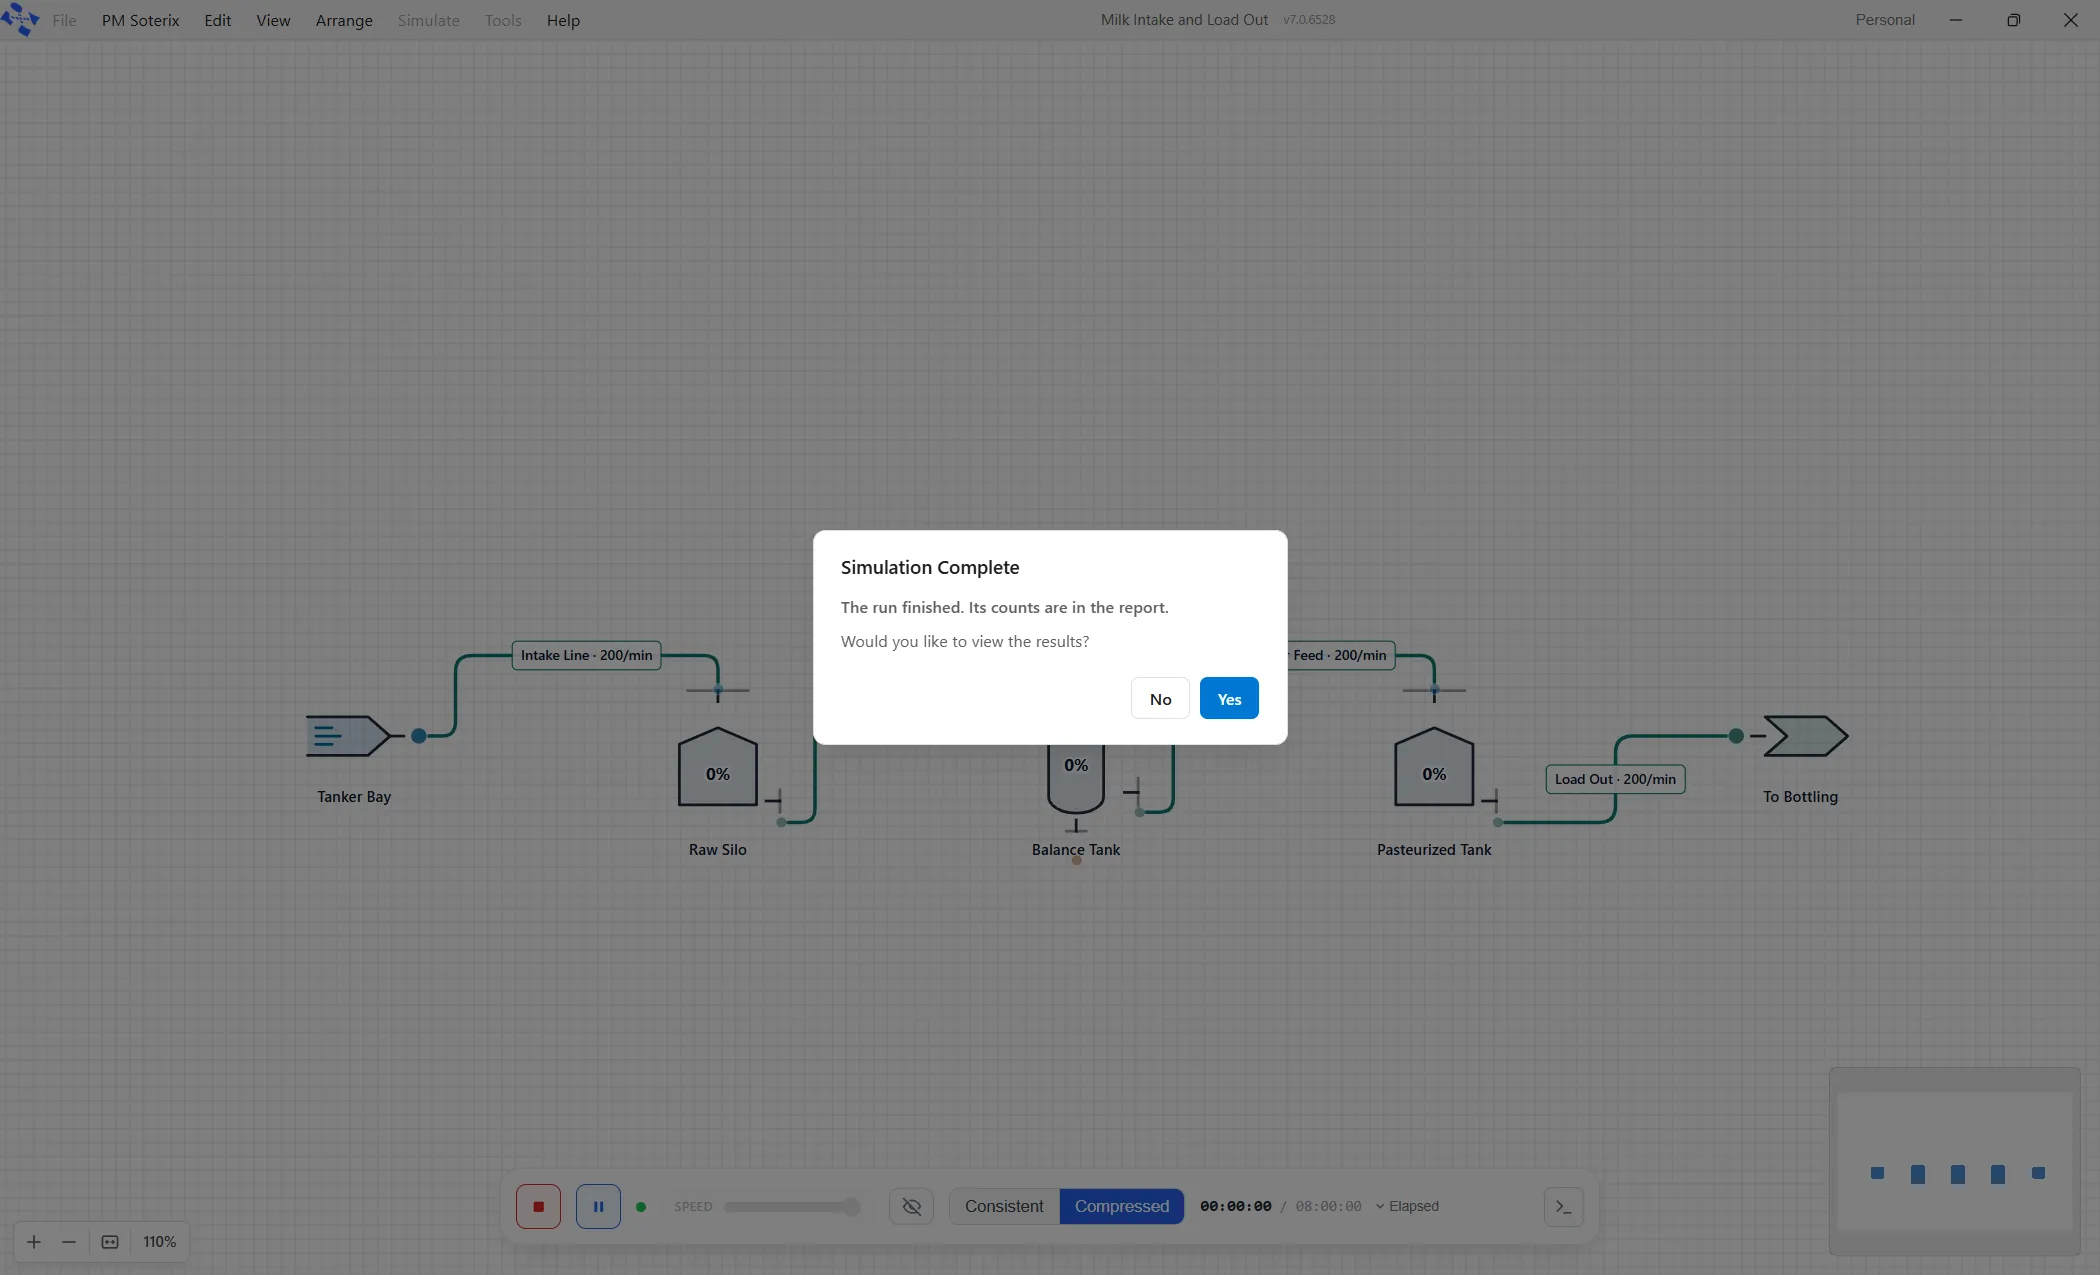
Section titled “3.8 Step seven: run it”Click the blue triangle on the toolbar, or press Ctrl+R. A card appears saying Simulation Complete and asking whether you want to see the results. Click Yes.
The finished plant looks like this.
Part 4. Reading the output
Section titled “Part 4. Reading the output”Everything below was measured on the model from Part 3. If you built it yourself, these are your numbers too.
4.1 The first thing it says is do not trust this run
Section titled “4.1 The first thing it says is do not trust this run”The report opens on a row of five questions across the top, starting with Can I trust it?, and it will be showing a red banner saying Do not trust this run, with one problem and two cautions. The problem is No entities completed.
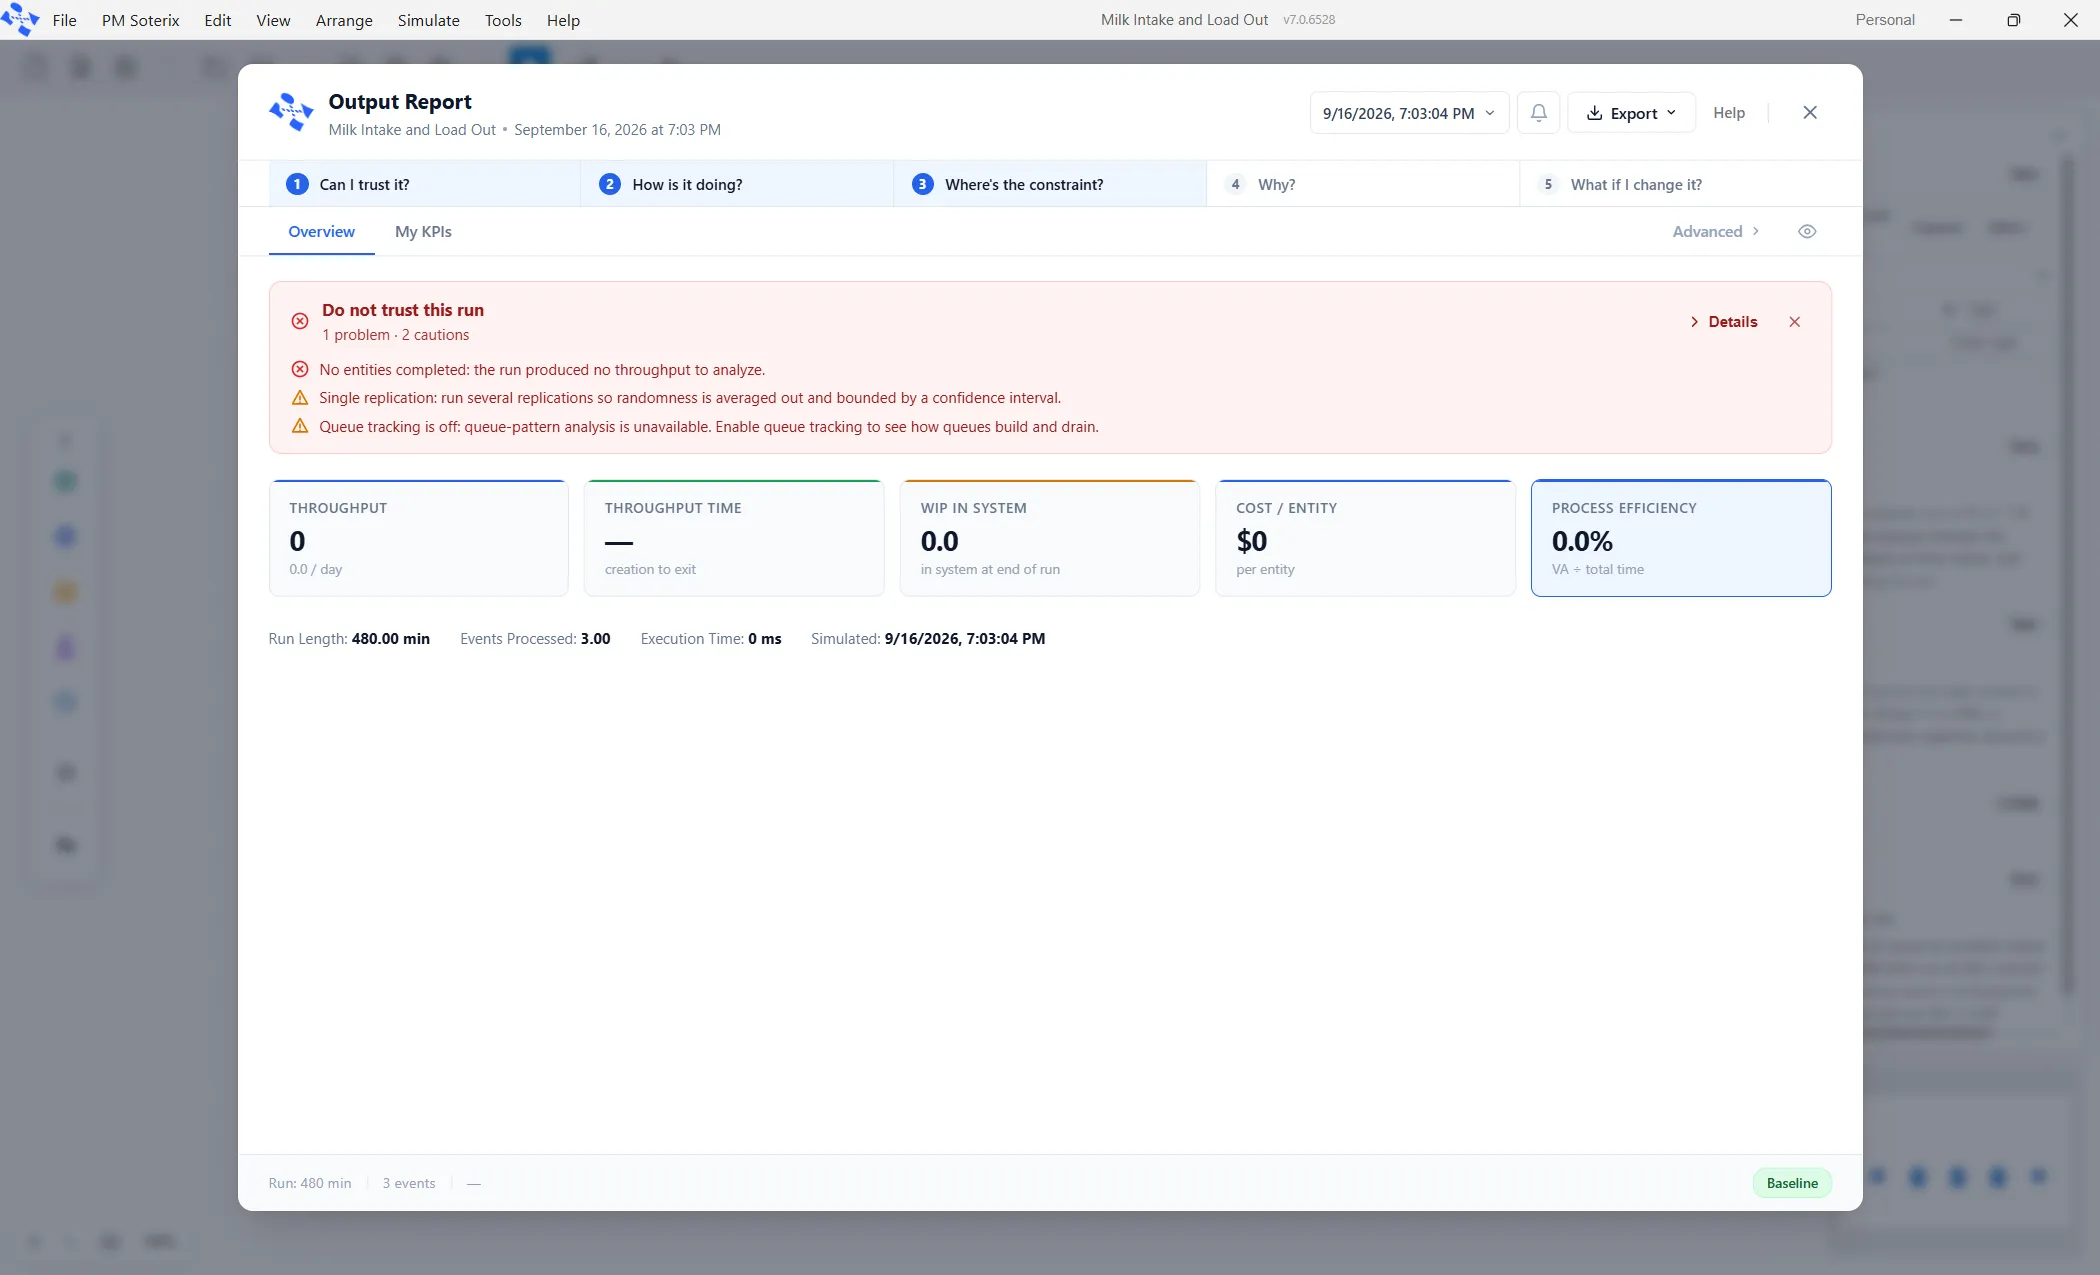
That is correct, and for this model it is fine. Our plant has no entities in it at all. Nothing is counted, everything is measured, so the throughput, work in progress and cost per entity tiles all read zero. Those tiles are about the counted half of the product, and our plant lives entirely in the measured half.
The two cautions are worth reading properly rather than dismissing. One says the run was a single replication, so nothing is averaged and there is no confidence interval. That is true, and for a model with no randomness in it a single replication is all you need. The other says queue tracking is off, which does not apply to a plant with no queues.
4.2 Levels over time
Section titled “4.2 Levels over time”The first thing on the Bulk tab is a chart of every vessel’s level through the run. For this model it is almost the whole story in one picture: the Raw Silo climbs in a straight line for about four and a half hours, reaches 30,000 gallons, and stays there. The other two vessels sit flat on the bottom axis for the entire shift.
A straight climb means a constant difference between what is coming in and what is going out. The flat top means the vessel filled and stopped accepting. The two flat lines along the bottom mean those vessels passed everything straight through without ever accumulating a gallon, which is exactly what a vessel does when its outlet is faster than its inlet.
4.3 The mass balance
Section titled “4.3 The mass balance”Under the chart is a single row per material, and it is the line that proves the model is honest.
| Material | Unit | Opening | Receipts | Output | Losses | Closing | Residual | Verdict |
|---|---|---|---|---|---|---|---|---|
| Raw Milk | gal | 0.000 | 74,160.000 | 44,160.000 | 0.000 | 30,000.000 | -0.000000 | OK |
Read it as arithmetic. The plant started empty. It took in 74,160 gallons and shipped 44,160. Nothing was lost. What is left inside the plant is 30,000 gallons, which is the Raw Silo sitting full. Opening plus receipts, less output and losses, equals closing, and the residual is zero.
4.4 The Tanks table
Section titled “4.4 The Tanks table”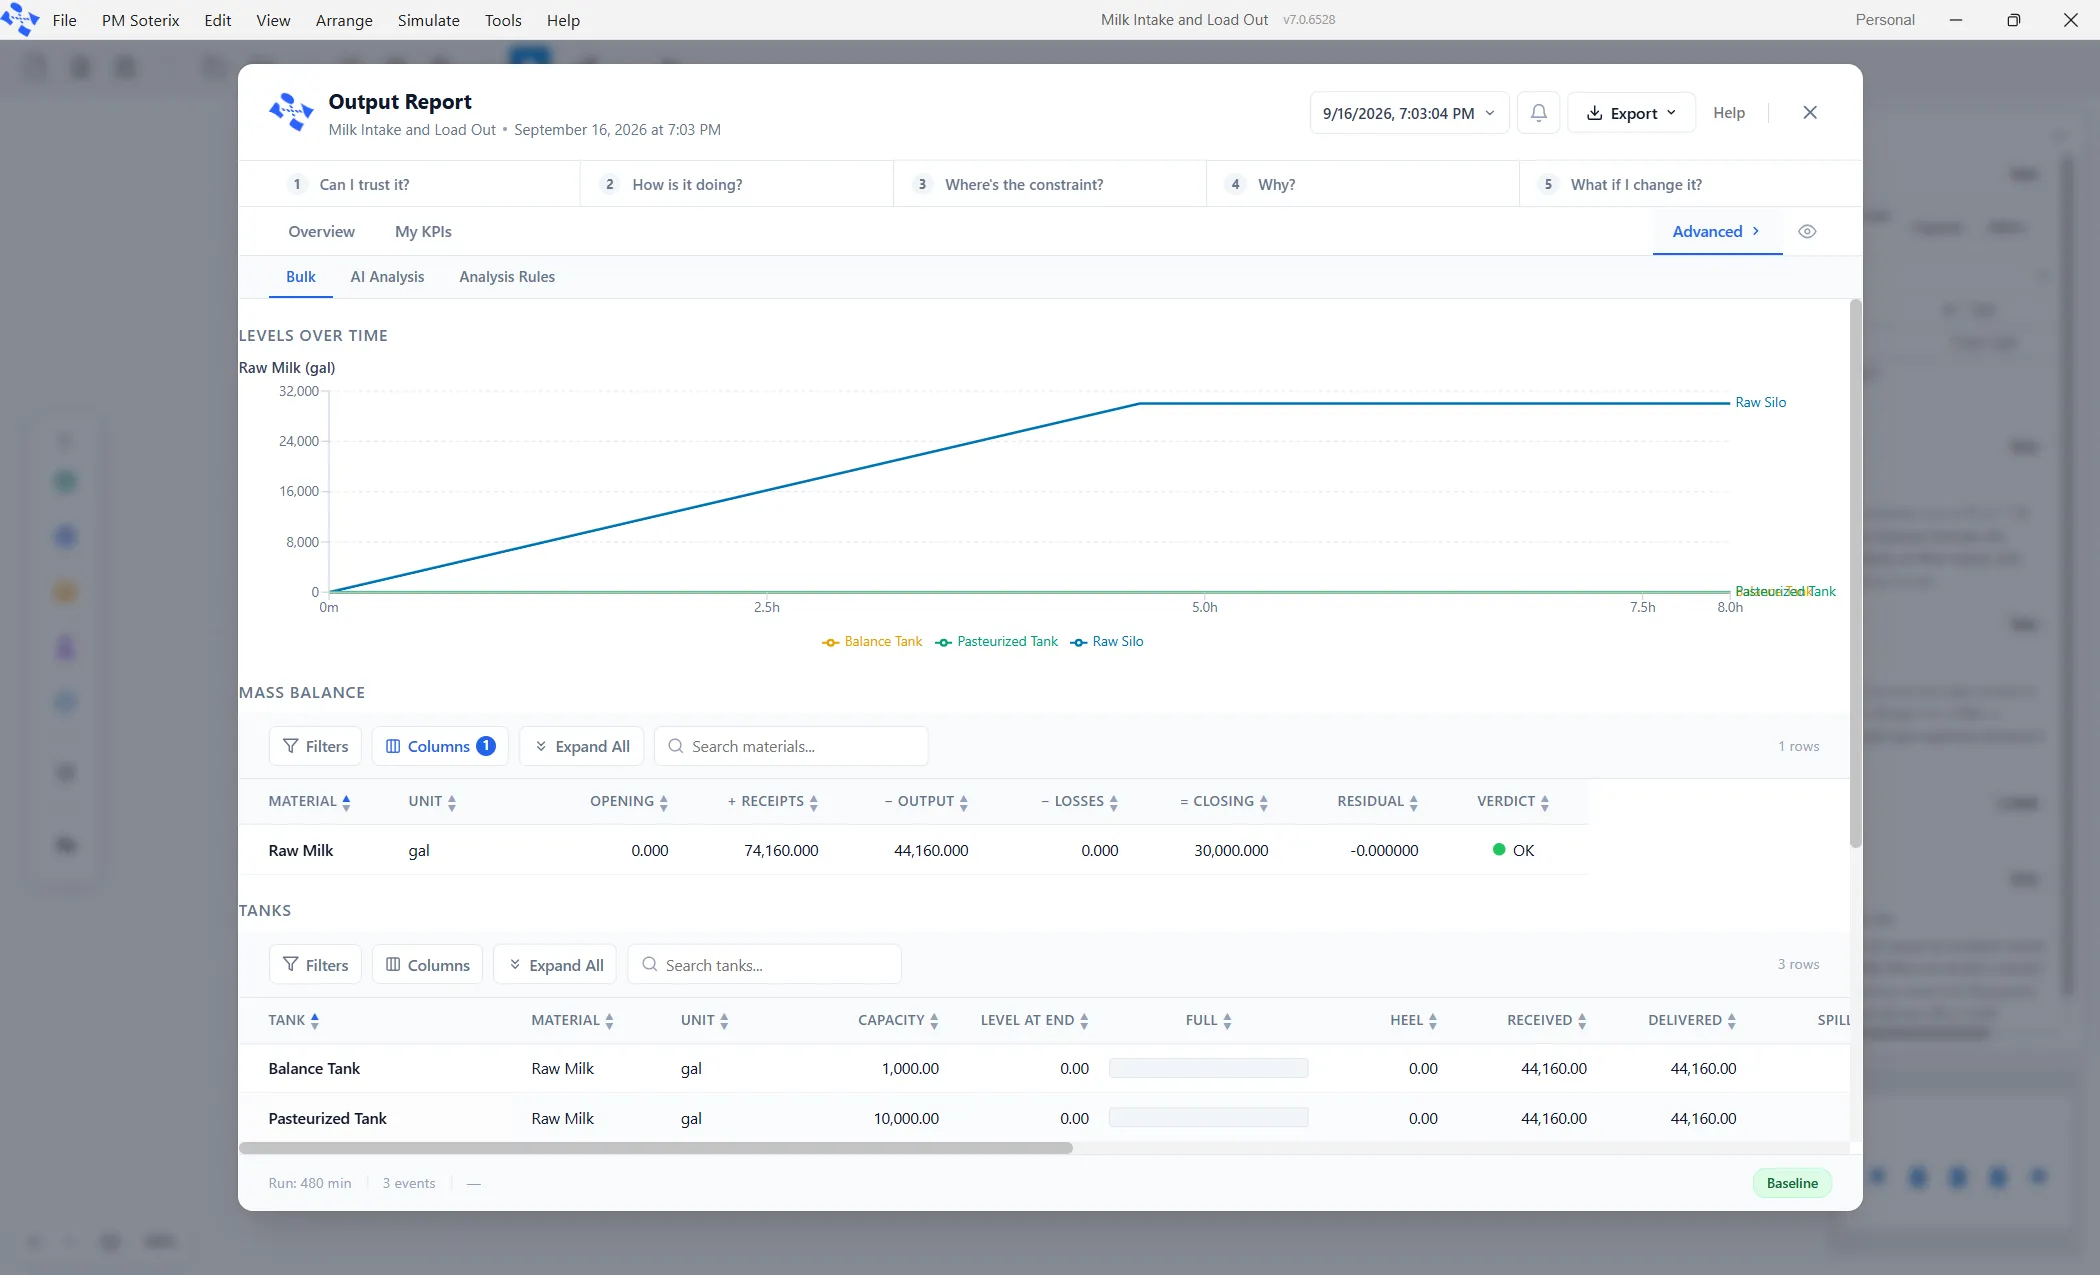
Here are the three vessels, with the columns that matter for a first reading.
| Tank | Capacity | Received | Delivered | Level at end | Avg level | % Time Full | % At Heel | Turnovers |
|---|---|---|---|---|---|---|---|---|
| Raw Silo | 30,000 | 74,160 | 44,160 | 30,000 | 21,319 | 42.1 | 0.0 | 1.47 |
| Balance Tank | 1,000 | 44,160 | 44,160 | 0 | 0 | 0.0 | 100.0 | 44.16 |
| Pasteurized Tank | 10,000 | 44,160 | 44,160 | 0 | 0 | 0.0 | 100.0 | 4.42 |
What each column is telling you:
Received and Delivered are the totals in and out over the run. On the Raw Silo they differ by 30,000, which is the milk still standing in it at the end.
Avg level is time weighted. A vessel that sat full for a minute and empty for an hour does not read as half full. The Raw Silo averaged 21,319 gallons because it spent most of the shift well up the wall.
% Time Full is the share of the run the vessel spent refusing material it was offered. The Raw Silo spent 42.1 per cent of the shift turning milk away, which is the same as saying the flat top of the chart is about two fifths of the width.
% At Heel is the share of the run the vessel was down at its unpumpable bottom. Both of the pass through vessels read 100 per cent, because they never held anything. This is the number that answers whether a pump is starving.
Turnovers is delivered divided by working volume, and it is how plants judge whether a vessel is the right size. The Balance Tank turned over 44 times in a shift, which says it is doing its job as a small buffer. The Raw Silo turned over 1.47 times, which says it is storage. A vessel at 0.3 is a warehouse with a pump on it.
4.5 The Transfer Lines table
Section titled “4.5 The Transfer Lines table”Scroll down and there is a row per pipe. This is where the answer is.
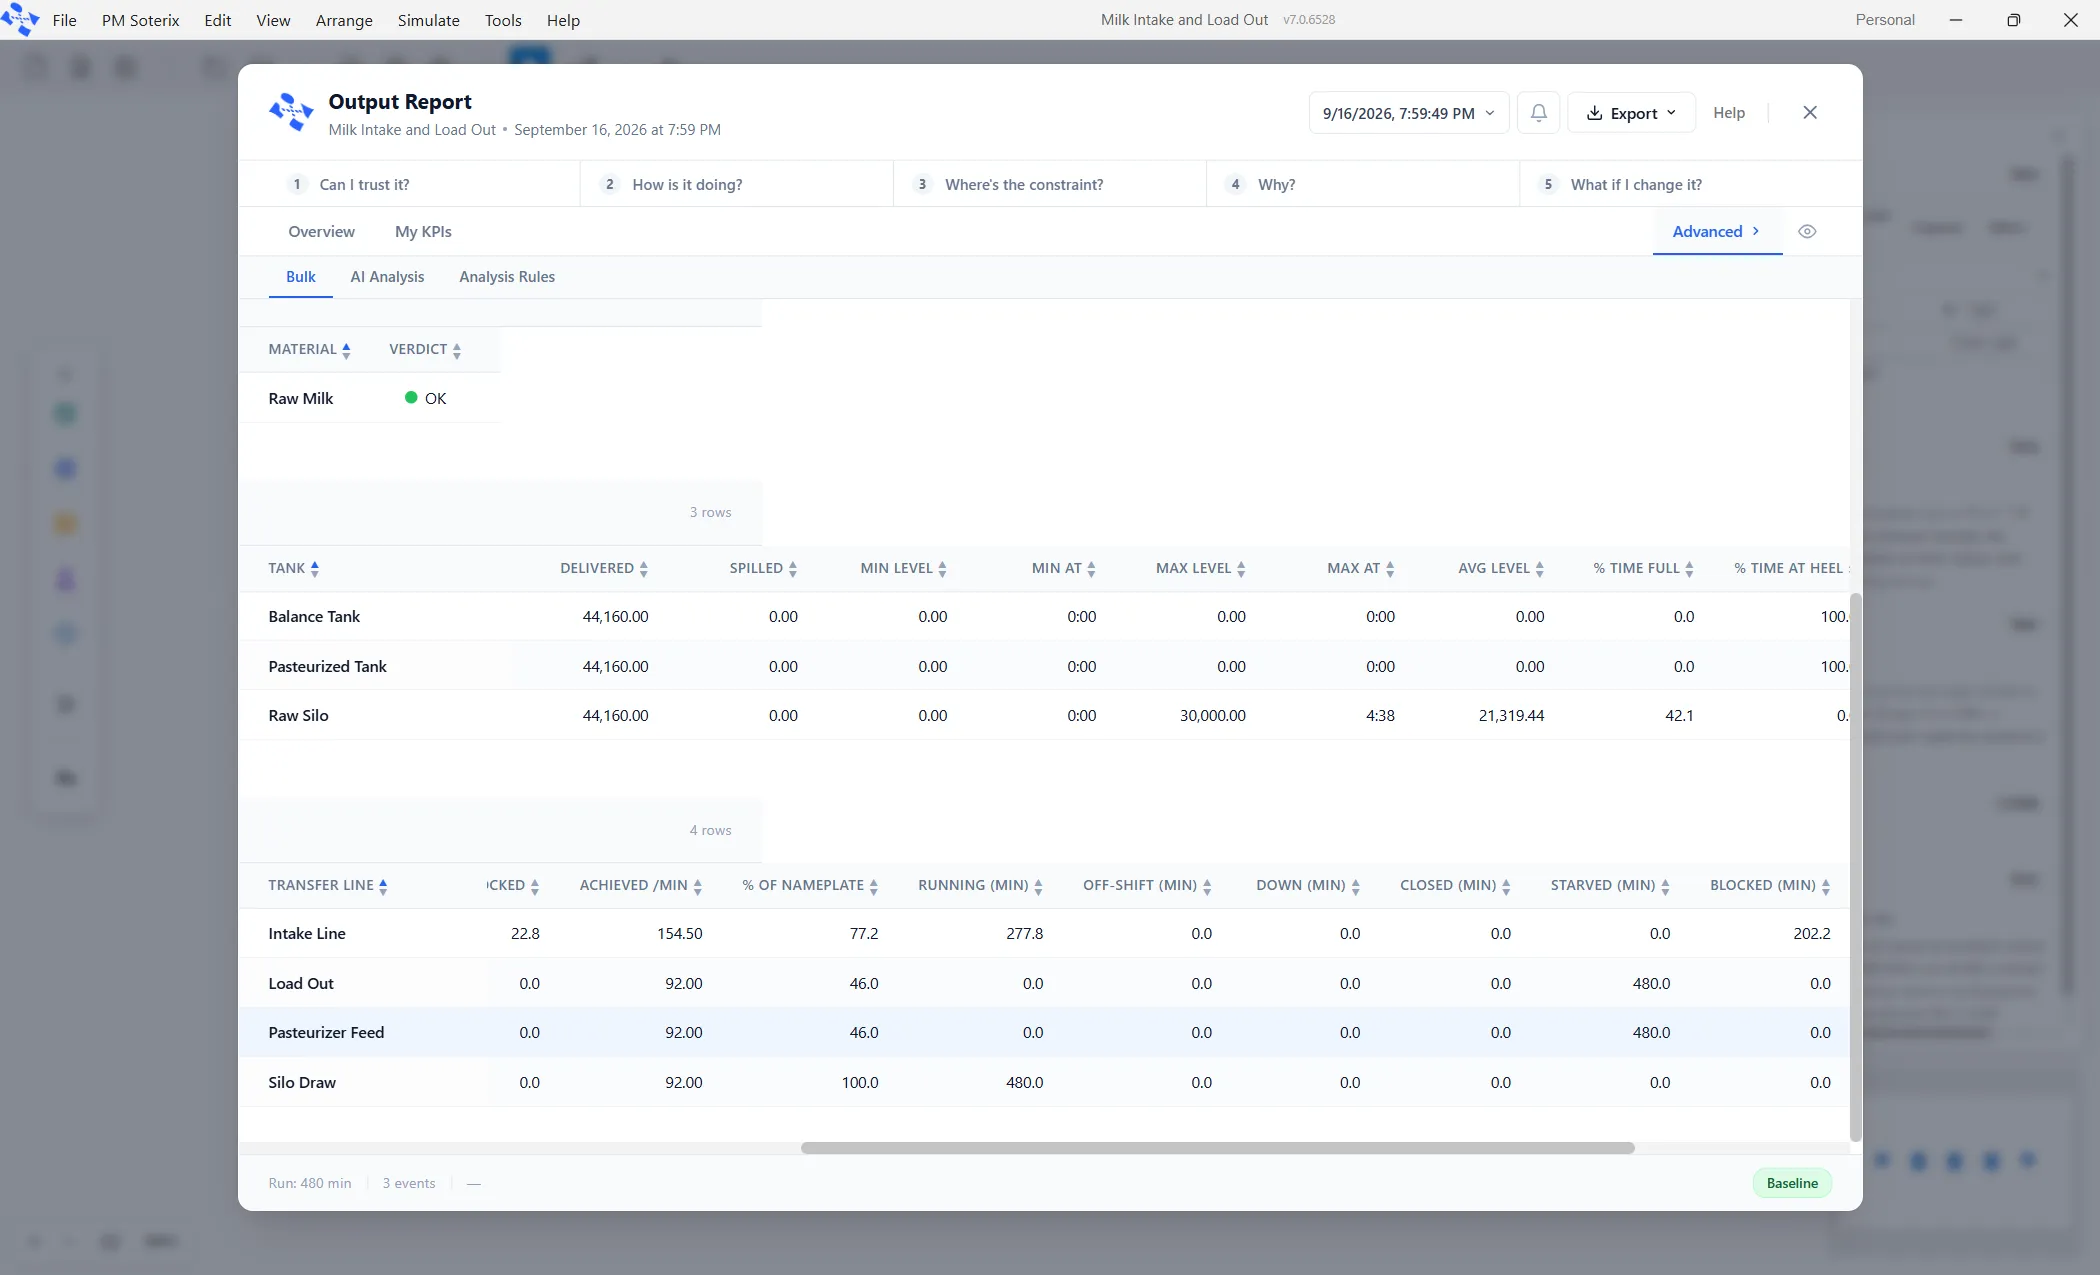
| Transfer line | Moved | Achieved /min | % of Nameplate | Running | Starved | Blocked |
|---|---|---|---|---|---|---|
| Intake Line | 74,160 | 154.50 | 77.2 | 277.8 | 0.0 | 202.2 |
| Silo Draw | 44,160 | 92.00 | 100.0 | 480.0 | 0.0 | 0.0 |
| Pasteurizer Feed | 44,160 | 92.00 | 46.0 | 0.0 | 480.0 | 0.0 |
| Load Out | 44,160 | 92.00 | 46.0 | 0.0 | 480.0 | 0.0 |
The last three columns belong to a set of six that always add up to the length of the run: Running, Off-shift, Down, Closed, Starved and Blocked. Nothing in this model has a shift, a breakdown or a valve command, so the other three are zero everywhere and the three shown here account for all 480 minutes on every row.
| Bucket | What it means |
|---|---|
| Running | Free to move material at its rated speed. Nothing was in its way. |
| Off-shift | A working window said not now. Not a fault and not a breakdown. |
| Down | Broken. This outranks every other reason: a failed pump is failed whatever its tanks are doing. |
| Closed | Commanded shut, by a level mark, a wash, a changeover or a line of logic. |
| Starved | The source could not keep it fed at its rated speed. |
| Blocked | The destination could not take what it was offering. |
Starved does not mean it moved nothing
Section titled “Starved does not mean it moved nothing”This trips up nearly everyone on their first read. Look at Load Out. It reads 480 minutes Starved and 0 minutes Running, and it moved 44,160 gallons. Those are not in conflict. Starved means the source could not keep the pipe at its rated 200 a minute, and that was true for the whole shift, because milk only ever arrived in the Pasteurized Tank at 92. The pipe moved everything it was given and was never once able to stretch its legs.
The Achieved /min and % of Nameplate columns say the same thing in a friendlier way: Load Out managed 92 gallons a minute against a rating of 200, so 46 per cent.
Finding the constraint in one glance
Section titled “Finding the constraint in one glance”Everything else on the page is that one fact seen from a different angle. Above the Silo Draw, the Raw Silo fills and the Intake Line spends 202 minutes Blocked. Below it, both vessels sit at their heel and both pipes spend the whole shift Starved. Blocked upstream and Starved downstream are the same finding viewed from the two ends of the slow pipe, which is why the report keeps them in separate columns instead of adding them together.
The plant shipped 44,160 gallons. That is 92 a minute for 480 minutes: the whole plant ran at the rate of its slowest pipe, and no other number in it mattered.
4.6 Three experiments
Section titled “4.6 Three experiments”Change one field, run it again, compare. These three were measured on the same model and they are the fastest way to believe the rule above.
Experiment one: widen the intake
Section titled “Experiment one: widen the intake”Set the Intake Line to 400 gallons a minute and run it again. The tanker pump is now twice as fast.
The plant still ships 44,160 gallons. Not one gallon more. The Raw Silo now fills in half the time, so its % Time Full goes from 42.1 to 79.7 and the Intake Line’s Blocked minutes go from 202 to 383. All that changed is how much of the shift the intake pump spends standing against a full silo. This is the most common wrong lever in a real plant, and it costs real money.
Experiment two: buy a bigger silo
Section titled “Experiment two: buy a bigger silo”Put the Intake Line back to 200 and set the Raw Silo capacity to 60,000 gallons instead of 30,000.
The plant still ships 44,160 gallons. The silo now never fills at all: it ends the shift holding 51,840 gallons, and its % Time Full is zero. The Intake Line is no longer blocked and runs at its full 200 a minute all shift. The plant received more milk and shipped exactly the same amount, which means the extra tank bought storage, not output.
Experiment three: uprate the slow pipe
Section titled “Experiment three: uprate the slow pipe”Put the silo back to 30,000 and change the Silo Draw from 92 to 184 gallons a minute.
The plant ships 88,320 gallons, exactly double. The Intake Line now runs at its full 200 a minute for the whole shift, and the Raw Silo ends holding only 7,680 gallons because the plant is finally drawing nearly as fast as it receives.
| Change | Shipped | What actually moved |
|---|---|---|
| Nothing (baseline) | 44,160 | The Silo Draw at 92 a minute sets the pace. |
| Intake 200 to 400 | 44,160 | Nothing. The silo just fills sooner and the intake waits longer. |
| Silo 30,000 to 60,000 | 44,160 | Nothing shipped. The plant holds more milk overnight. |
| Silo Draw 92 to 184 | 88,320 | Output doubles. This was the only pipe that mattered. |
Part 5. The rest of the palette, through the shipped models
Section titled “Part 5. The rest of the palette, through the shipped models”Five models ship with the product, built from the fluid elements. Between them, they use every tile on the Dairy face. Open each one with File, then Demo Models, then Manufacturing.
Read them in this order. Each adds one idea to the one before, and the last is a whole plant that uses all of them at once. Each has a written case study behind the Brief button on its card, plus text blocks on the canvas explaining how it is built and what to look for.
5.1 Waiting on the Vat
Section titled “5.1 Waiting on the Vat”What it adds: the Pasteurizing Vat, level marks, valve commands, and the pattern for putting a fluid plant under discrete control.
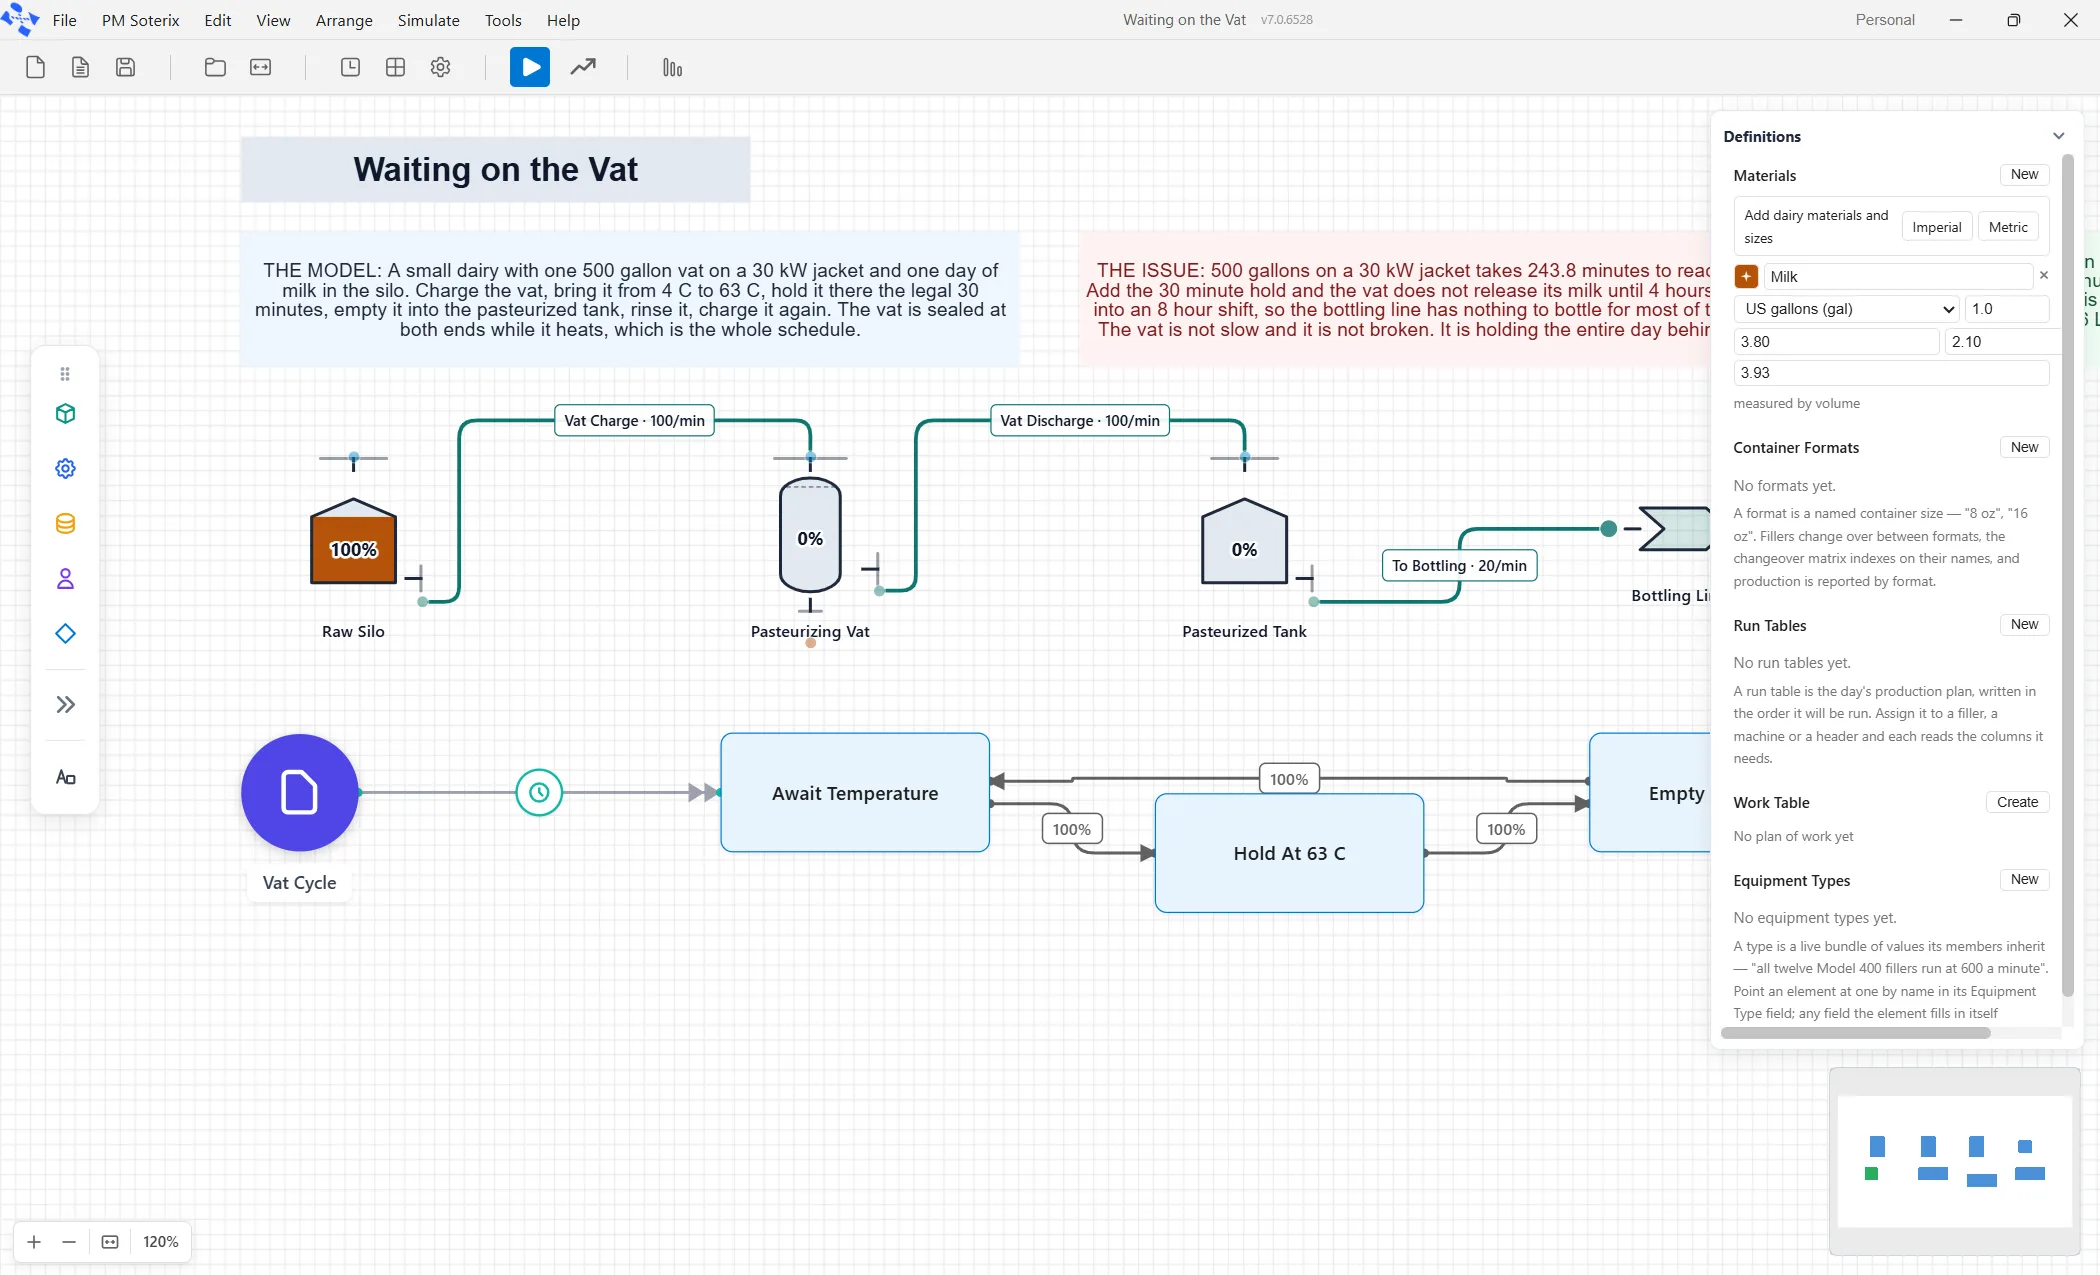
One small dairy vat pasteurizes the day’s milk. Fill it, bring it from 4 degrees to 63, hold it there the legal thirty minutes, empty it, rinse it, do it again. The finding is that 500 gallons on a 30-kilowatt jacket takes 243.8 minutes to come up to temperature, so the vat releases nothing until four hours and thirty-nine minutes into an eight-hour shift, and the bottling line has nothing to do all morning.
Three things to look at in the model itself.
The vat carries the heat up. Five fields on the vessel: the starting temperature, the target temperature, the jacket duty in kilowatts, the price of electricity, and a line of logic to run when it gets there. Nothing simulates heat. The engine calculates a duration from the mass and the duty, then seals the vessel for that long.
A level mark stops the fill. The vat has an H mark at 500 gallons with the action set to stop inflow, which is the high switch on the real vessel.
The cycle is a discrete loop driving fluid valves. Above the plant sit four ordinary activities, with one token going round them forever: Await Temperature, Hold At 63 C, Empty And Rinse, and back. The routes between them carry OPENLINE(“Vat Discharge”) and CLOSELINE(“Vat Discharge”). This is the pattern to copy whenever a plant does something in a sequence: the sequence lives in activities, and the activities open and shut the pipes by name.
5.2 The Whey Takes the Volume
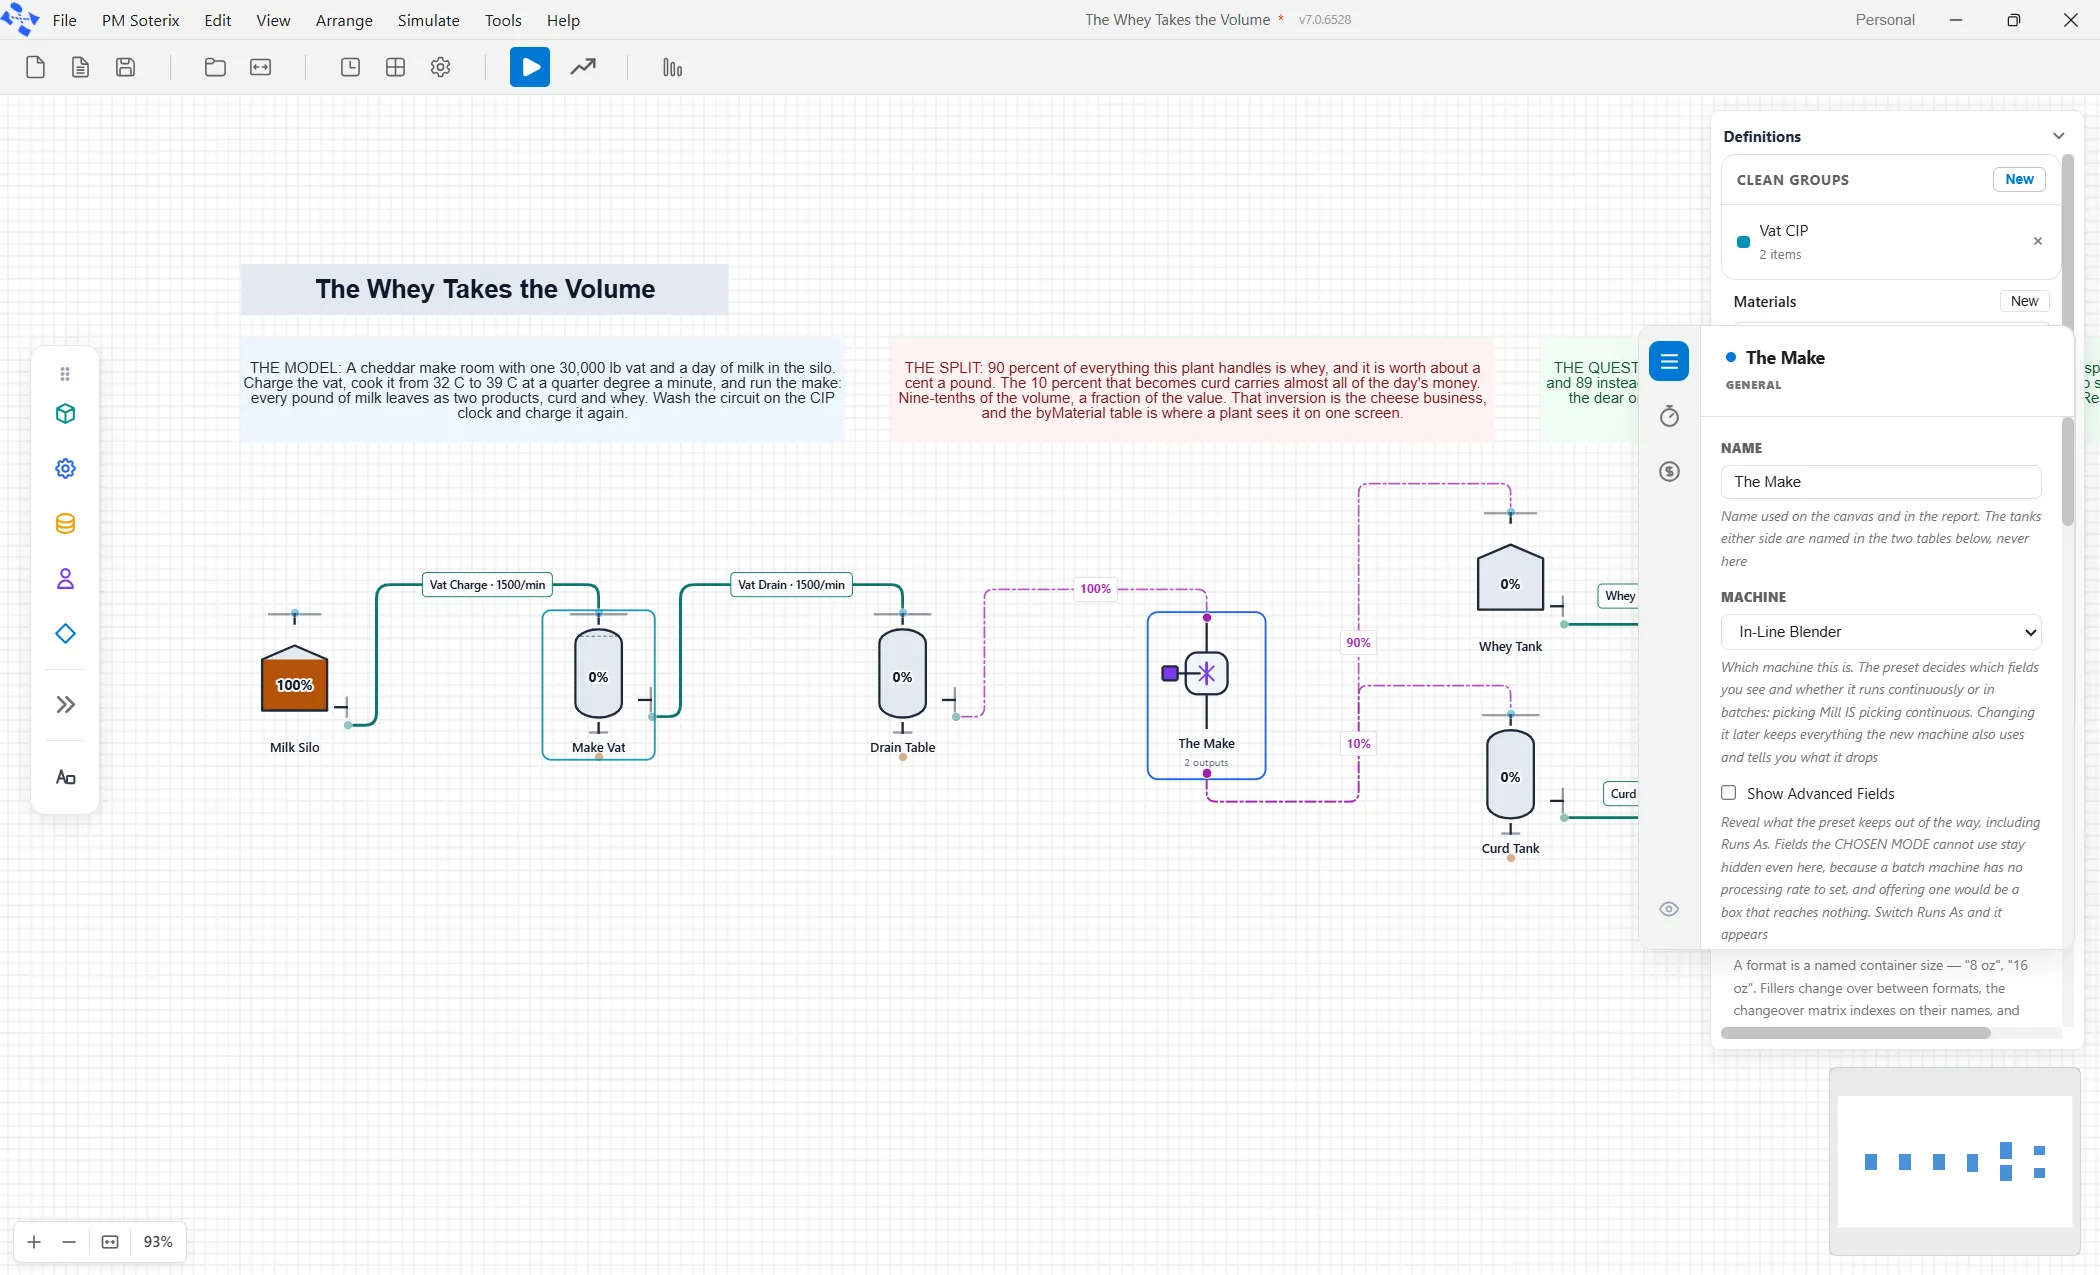
Section titled “5.2 The Whey Takes the Volume”What it adds: the Unit Operation, splitting one stream into two, and a clean group. It is also the purest fluid model of the five: it contains no entities, no routes and no activities at all.
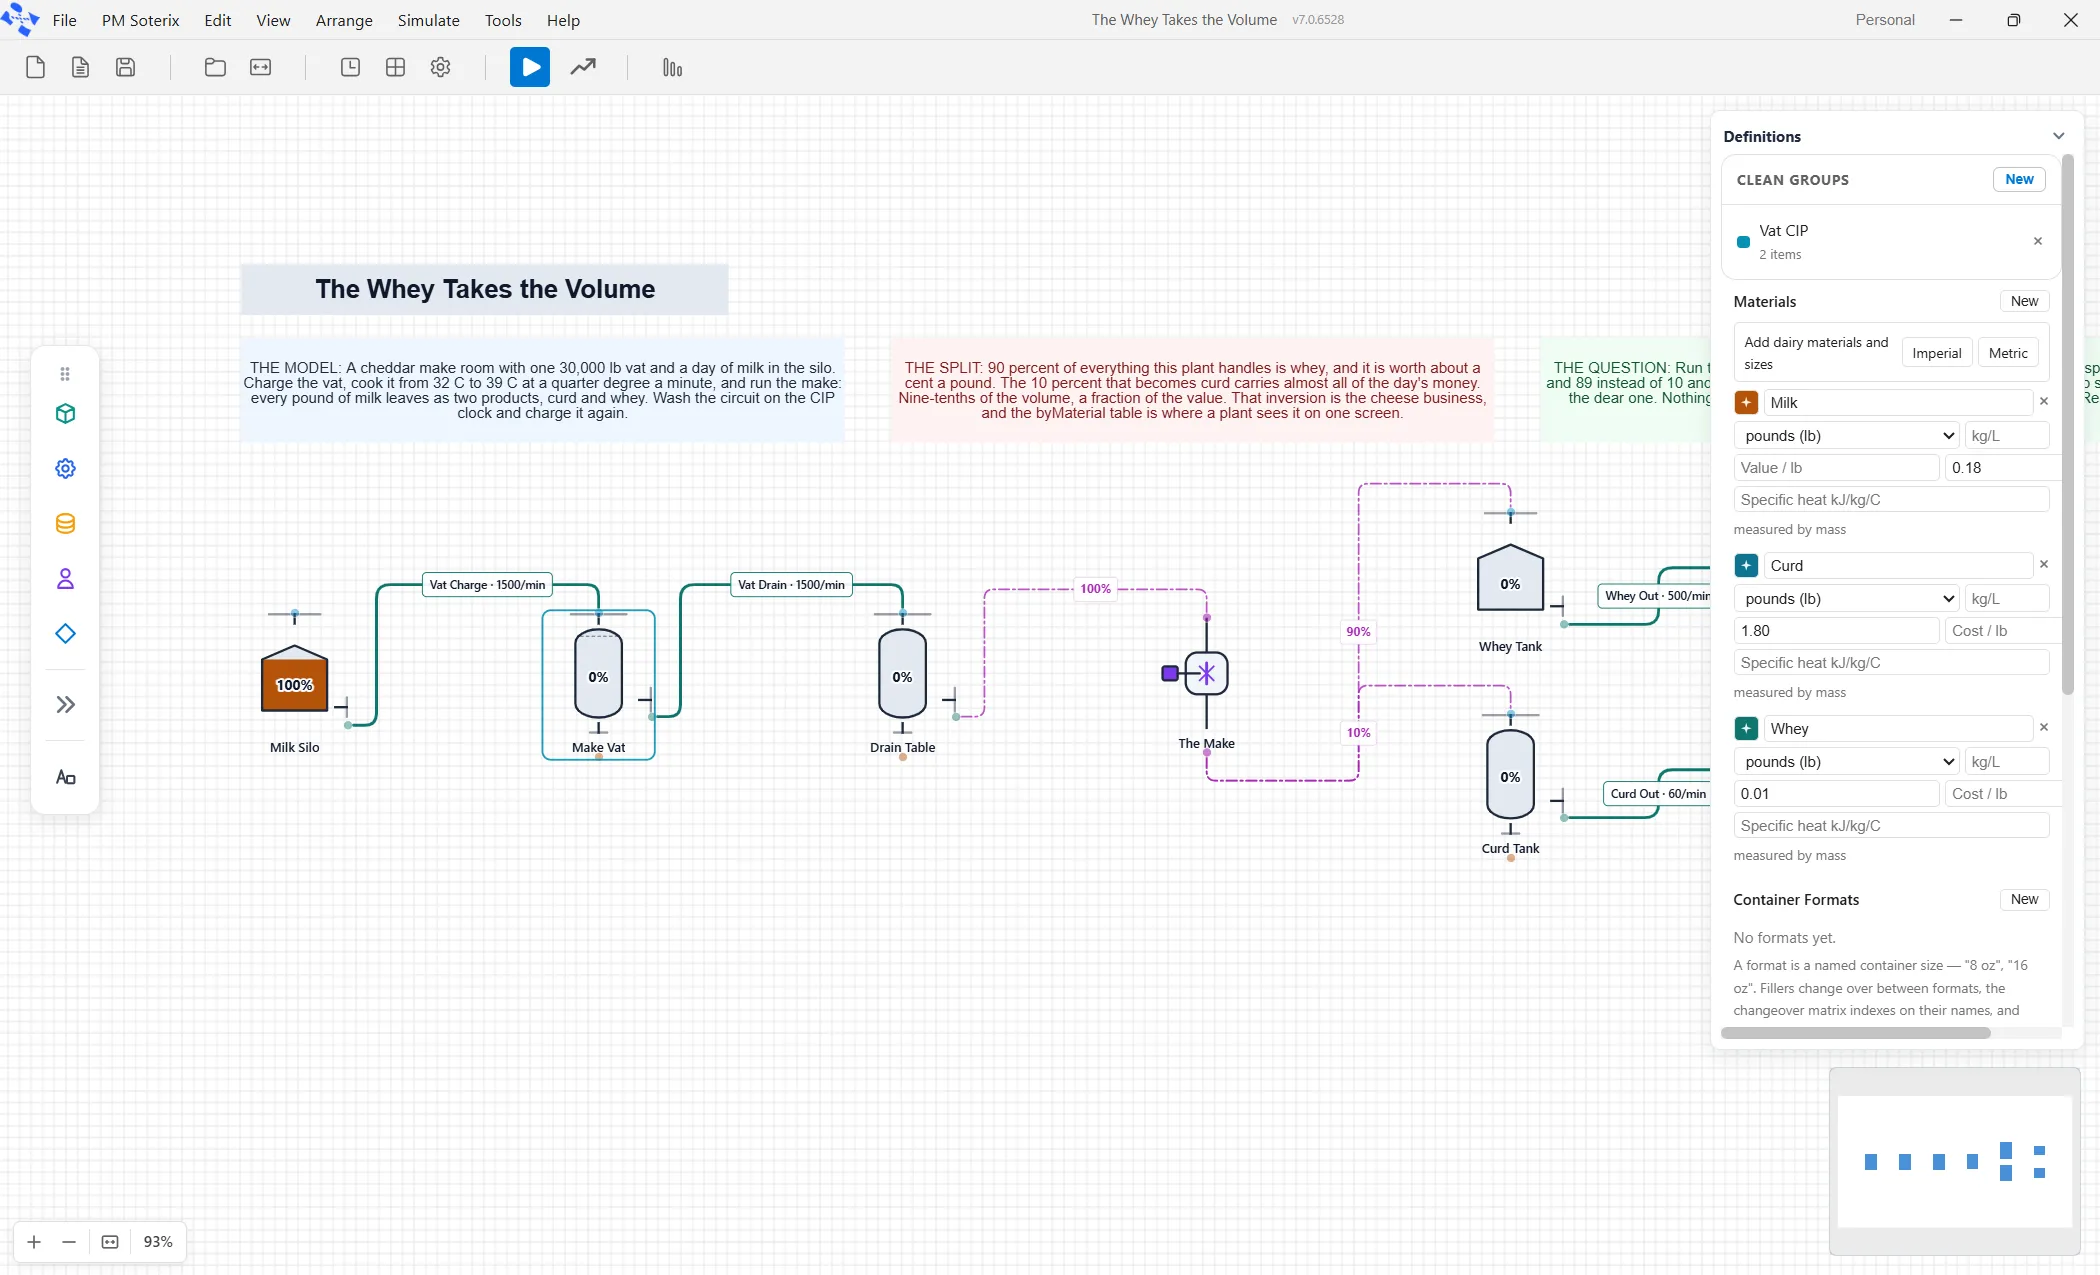
A cheese maker fills a vat with milk, cuts it, and drains the result into two vessels: one pound of curd for every nine of whey. The curd is worth 1.80 a pound and the whey a single cent, so the model exists to show that one point of yield is worth more than the entire day’s whey.
The Unit Operation is the machine. It takes one input vessel and writes to two output vessels with a percentage each, here 10 percent curd and 90 percent whey. That is the whole of what a separator, a clarifier, or a cheesemaking step is in this product: a fixed ratio you supply, with the mass accounted for exactly.
Materials change identity here. Milk goes in, and Curd and Whey come out. Identity comes from the tanks, not the machine.
A clean group washes equipment together. The Vat CIP group has the vat and the make step in it, triggers every 120 minutes, takes 25 minutes, and carries a cost. A clean group can hold vessels, activities, and resources, and its duration can be an expression such as T(15,20,25), unlike the quantity fields.
Level marks drive the whole cycle. The Make Vat has an L mark at 0 that closes the drain and opens the charge, and an H mark at 30,000 that stops the inflow and opens the drain. Two marks and four commands, and the vat fills and empties all day with no entities involved.
5.3 The Colours Run in Order
Section titled “5.3 The Colours Run in Order”What it adds: the Supply boundary, the Filler, container formats, the Manifold choosing by product, a run table, and setup groups.
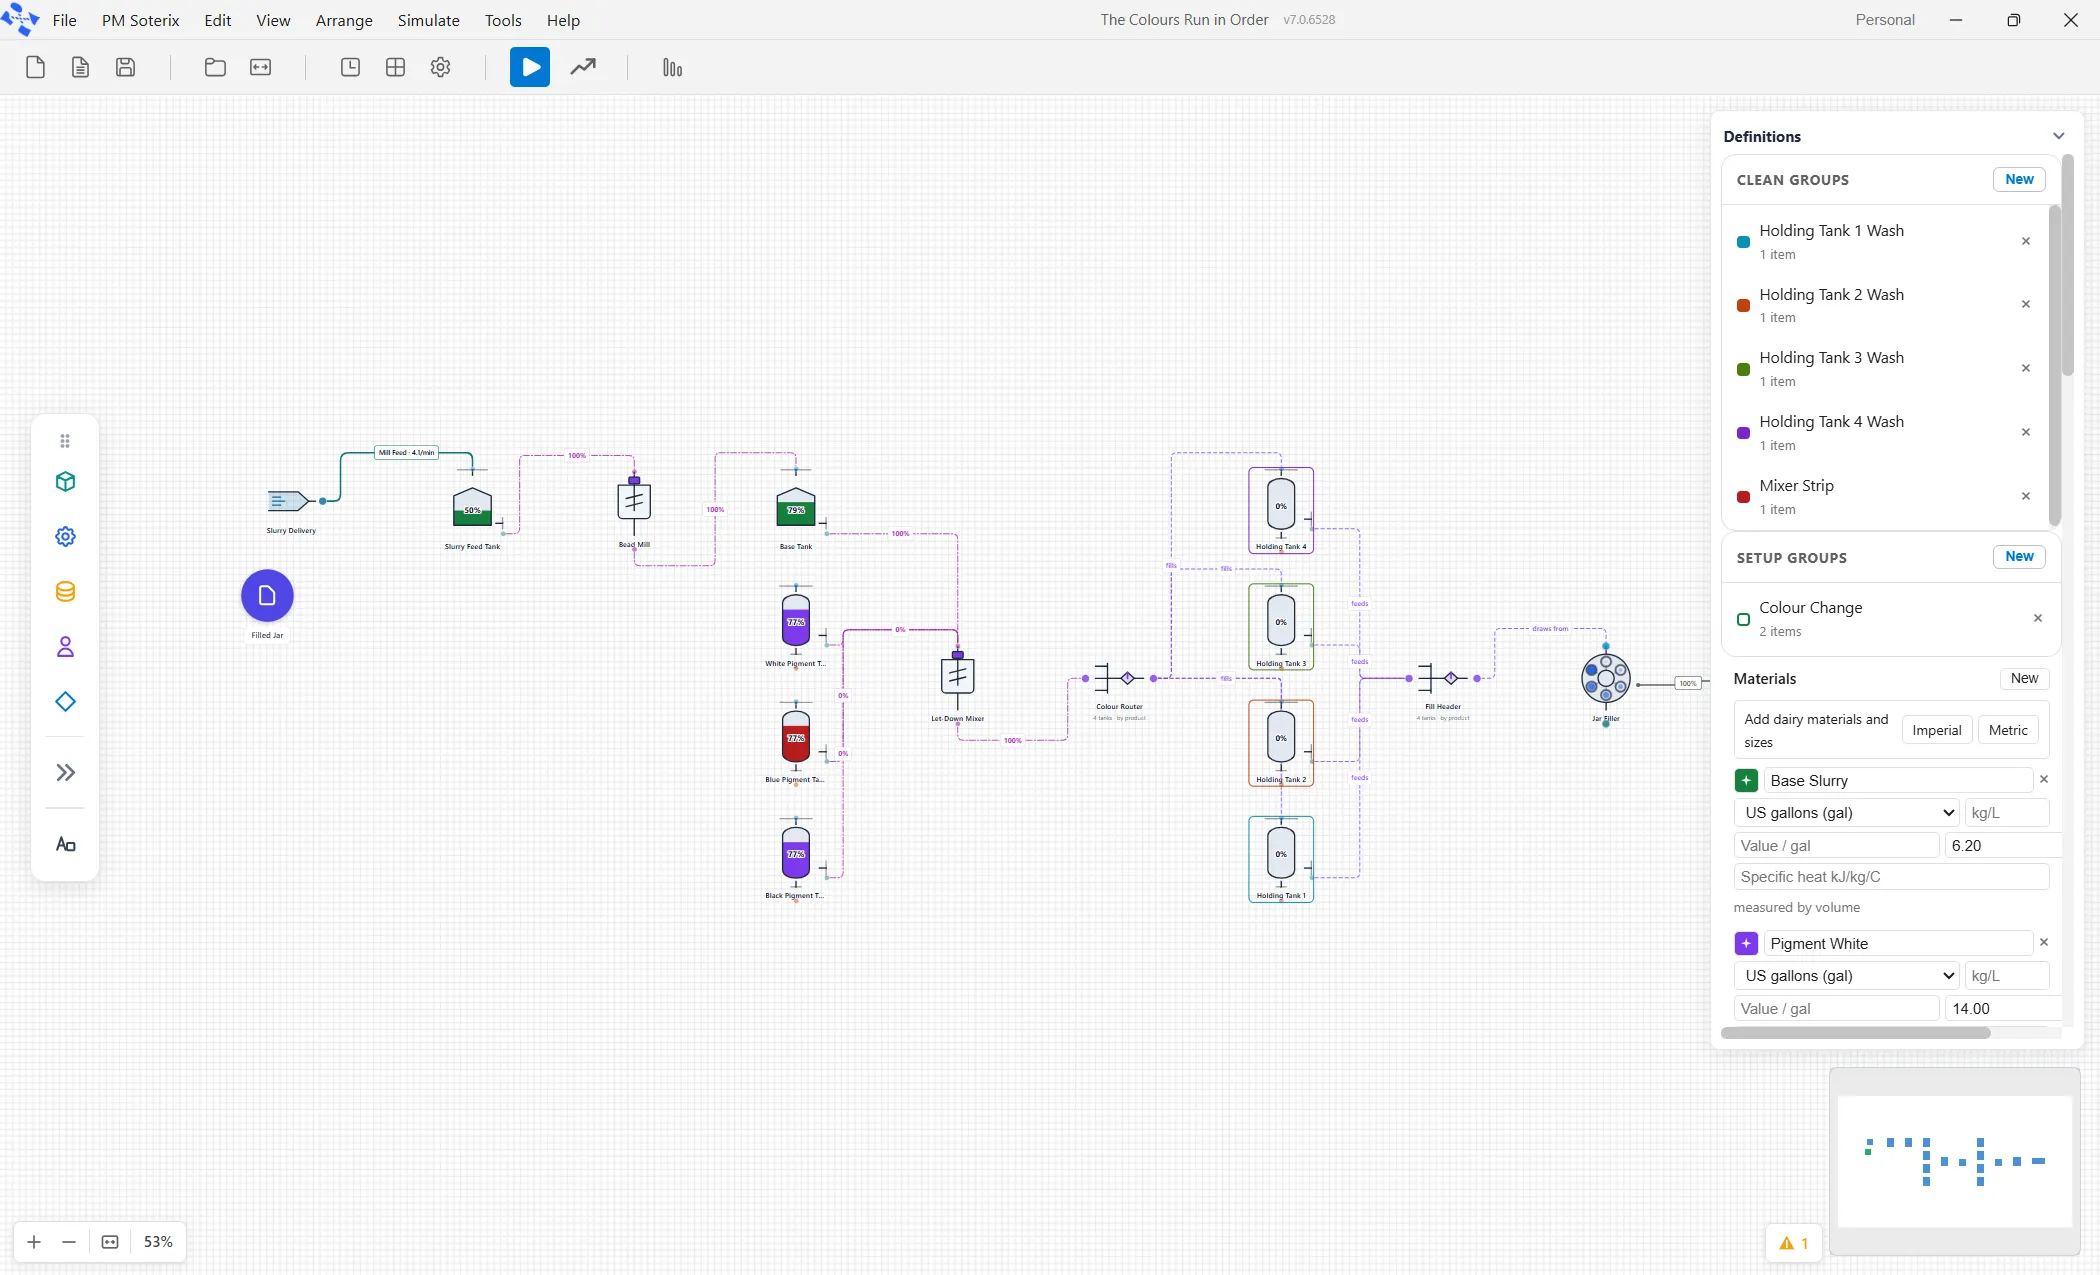
A ceramic paint line runs six colors through four holding tanks and fills three jar sizes. The planner writes the day “light to dark,” so every changeover is a rinse rather than a full strip. The model shows what moving one dark color two slots up the list costs in changeover minutes, using the same paint.
A Supply feeds the whole plant. The slurry arrives through a boundary rather than a made-up tank, so nothing upstream can be sized wrongly.
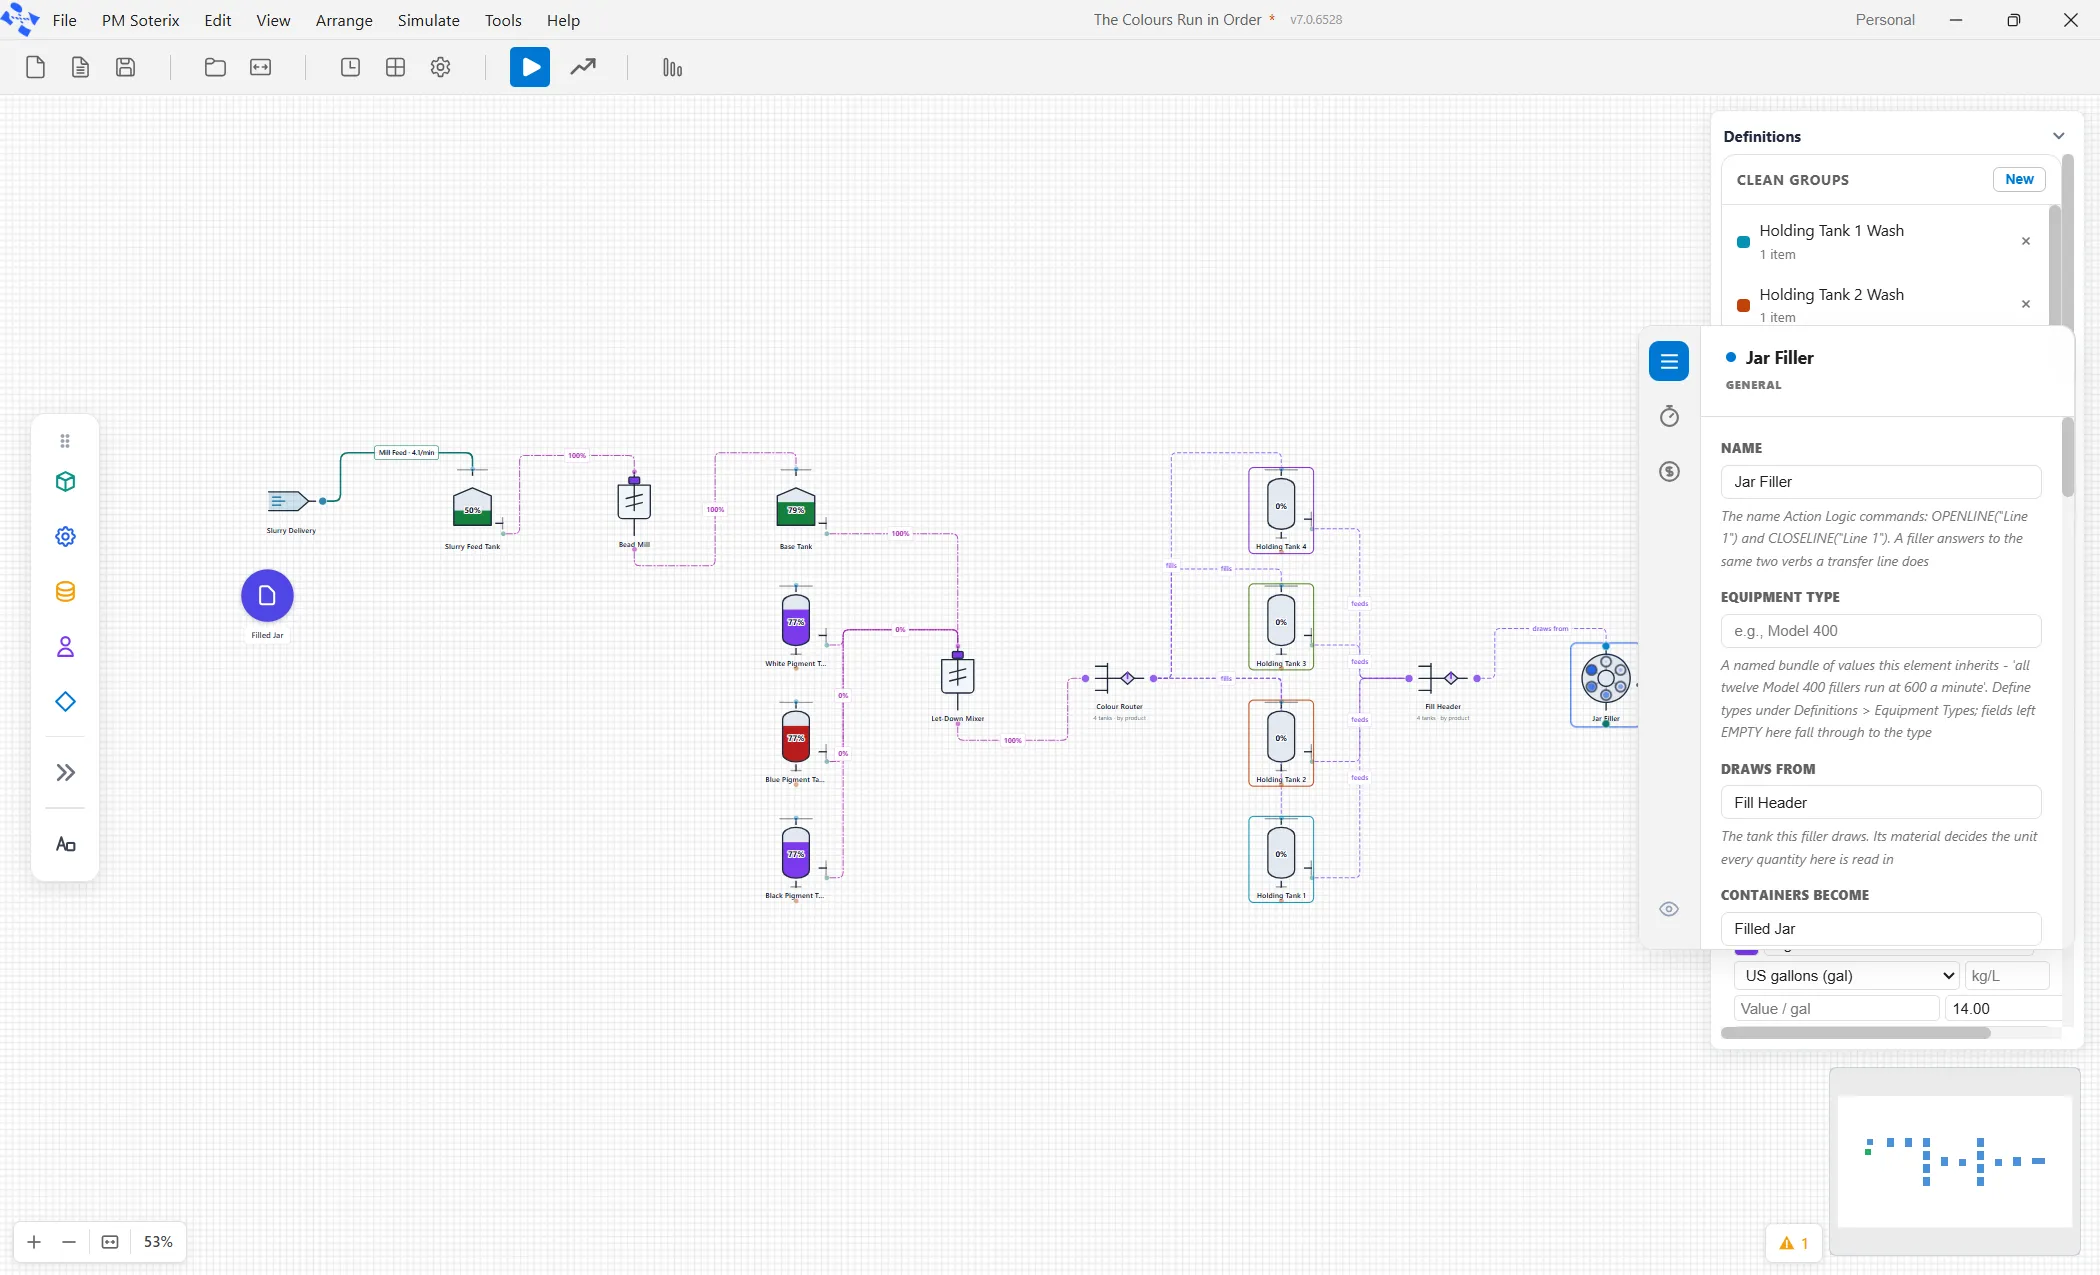
The Filler turns bulk into containers. It draws from a vessel and emits entities of a named type at a rate, each in a named container format. Formats are declared once in the Definitions panel (here 2 oz, Pint, and Gallon), and the filler’s changeover matrix prices the swap from one to another.
The Manifold picks by product. Two manifolds sit on either side of the four holding tanks: one chooses which tank to fill, and one chooses which to draw from, both keyed to the day’s run table. A manifold holds nothing itself. It selects from several interchangeable vessels.
A run table is the day’s plan. Rows of product, size, and quantity in the order they will run. The filler and both manifolds read the same table.
A setup group is not a clean group. The Color Change group covers the mixer and the filler and carries a matrix of durations from each color to each other color. A wash and a changeover are different events with different triggers, so they are separate constructs, and one element can belong to one of each.
5.4 QA Hold and Batch Release
Section titled “5.4 QA Hold and Batch Release”What it adds: the Discharge and the Dumper, which are the two remaining converters, and the pipe priority trap.
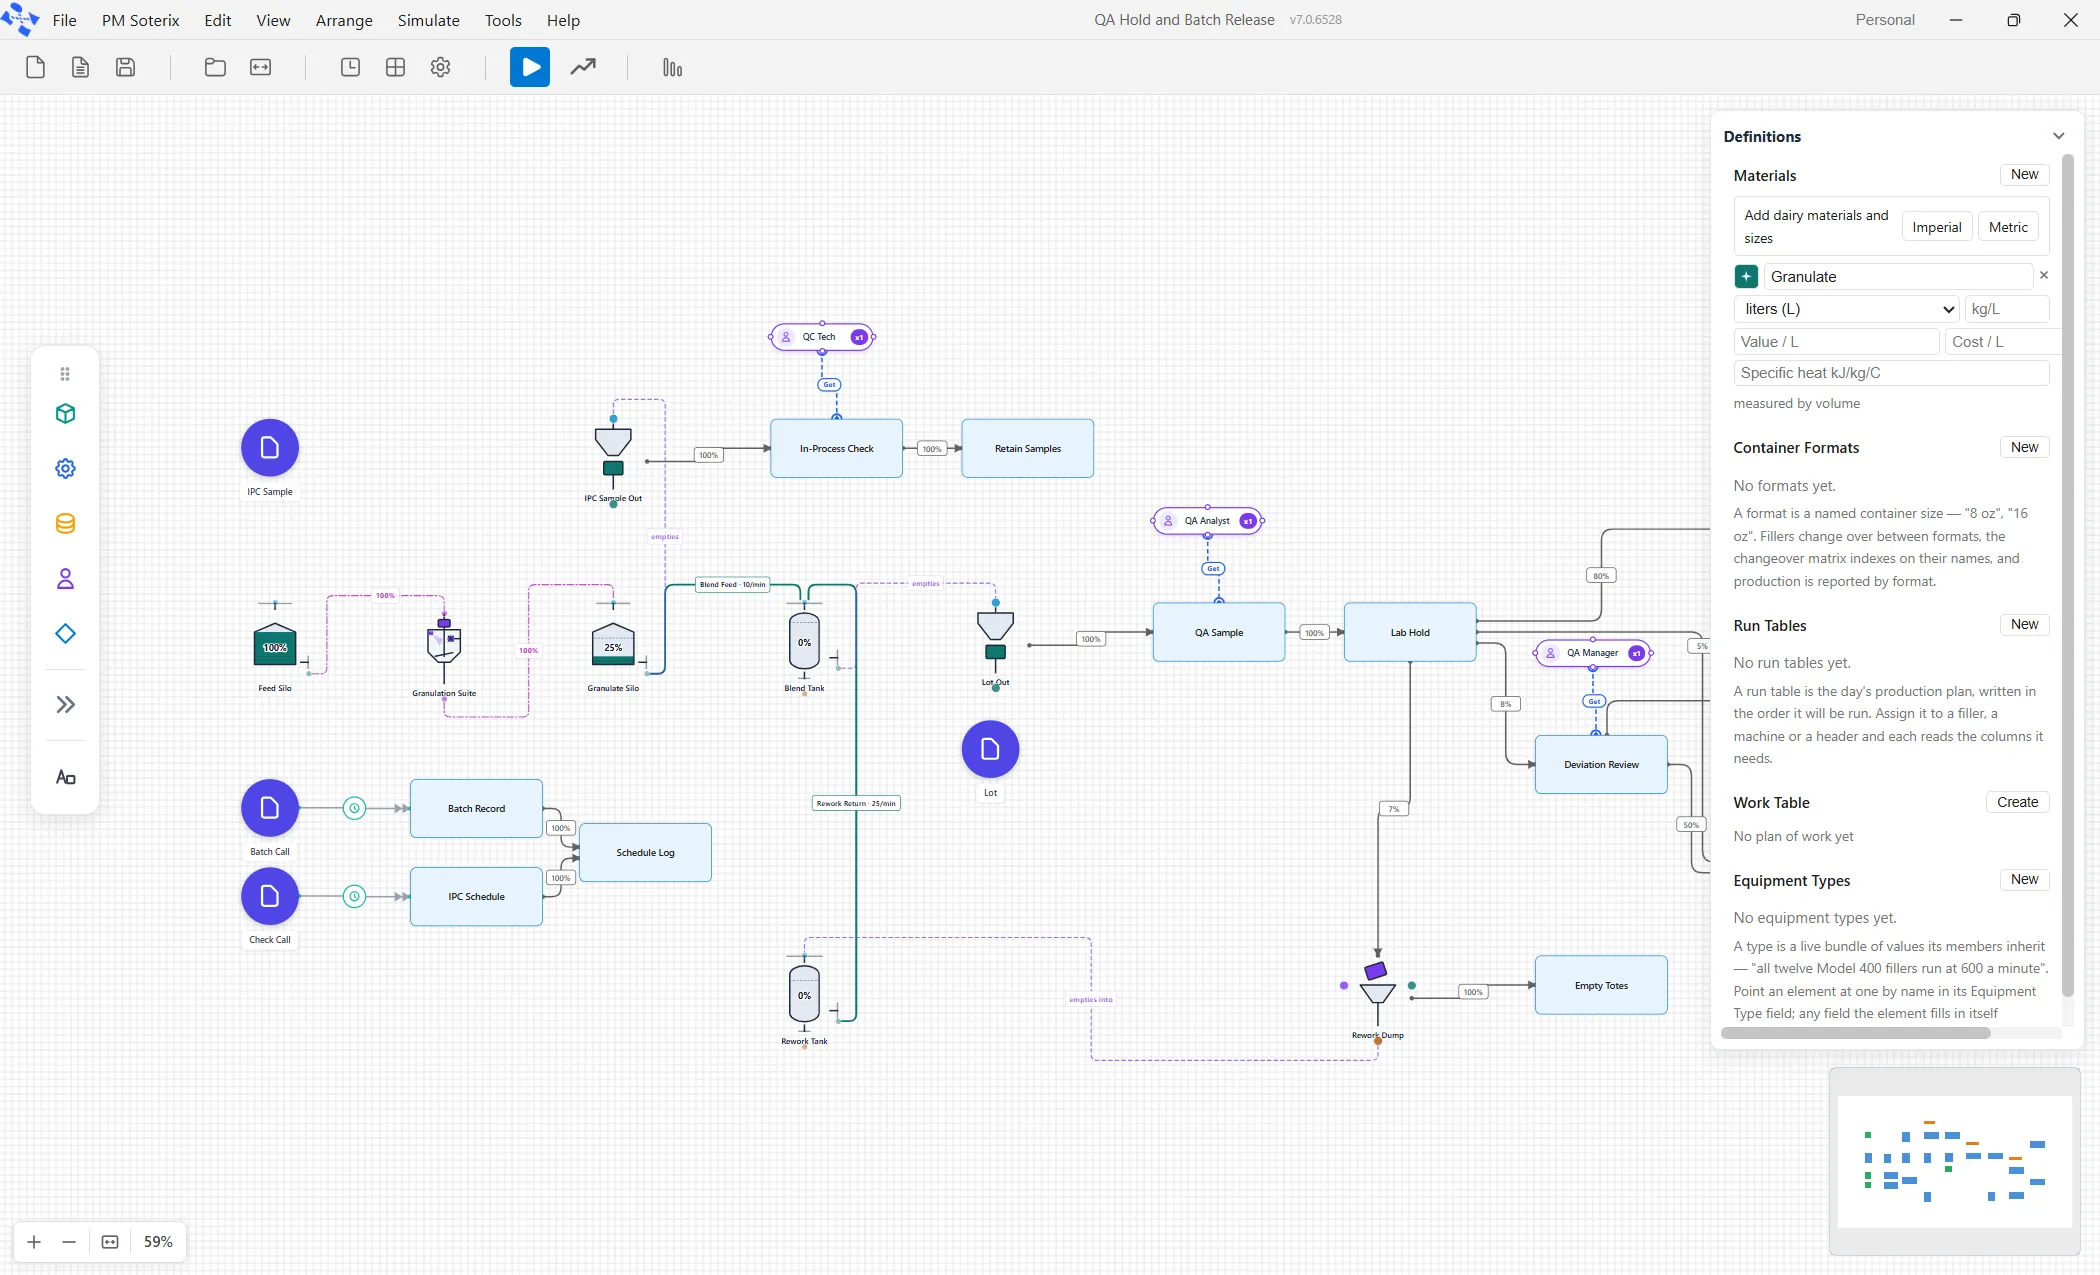
A granulation plant makes lots, the lab holds them, and QA releases, reworks or rejects each one. It is the clearest example of the seam between the two halves of the product.
A Discharge turns a tank into one entity. Lot Out empties the Blend Tank and the whole draw leaves as a single entity carrying its amount on a reserved attribute called BulkQty. From that instant it is an ordinary entity: it can queue, seize a person, be held, be reviewed and be rejected. A second Discharge on the same plant takes a fixed 20-liter sample from a different vessel, which is the pattern for sub-sampling.
A Dumper turns an entity back into material. A rejected lot routes into Rework Dump, which empties it into the Rework Tank and sends the emptied tote onward. That closes the loop: material becomes an entity, travels through the discrete world, and returns to a tank.
The discharge fires from logic. DISCHARGE(“Lot Out”) runs on an activity, so the batch record authorizes the batch rather than a timer.
5.5 The Fat Goes Out on the Cream Tanker
Section titled “5.5 The Fat Goes Out on the Cream Tanker”What it adds: everything at once. This is a whole fluid milk plant, and it is the model to return to rather than start with.
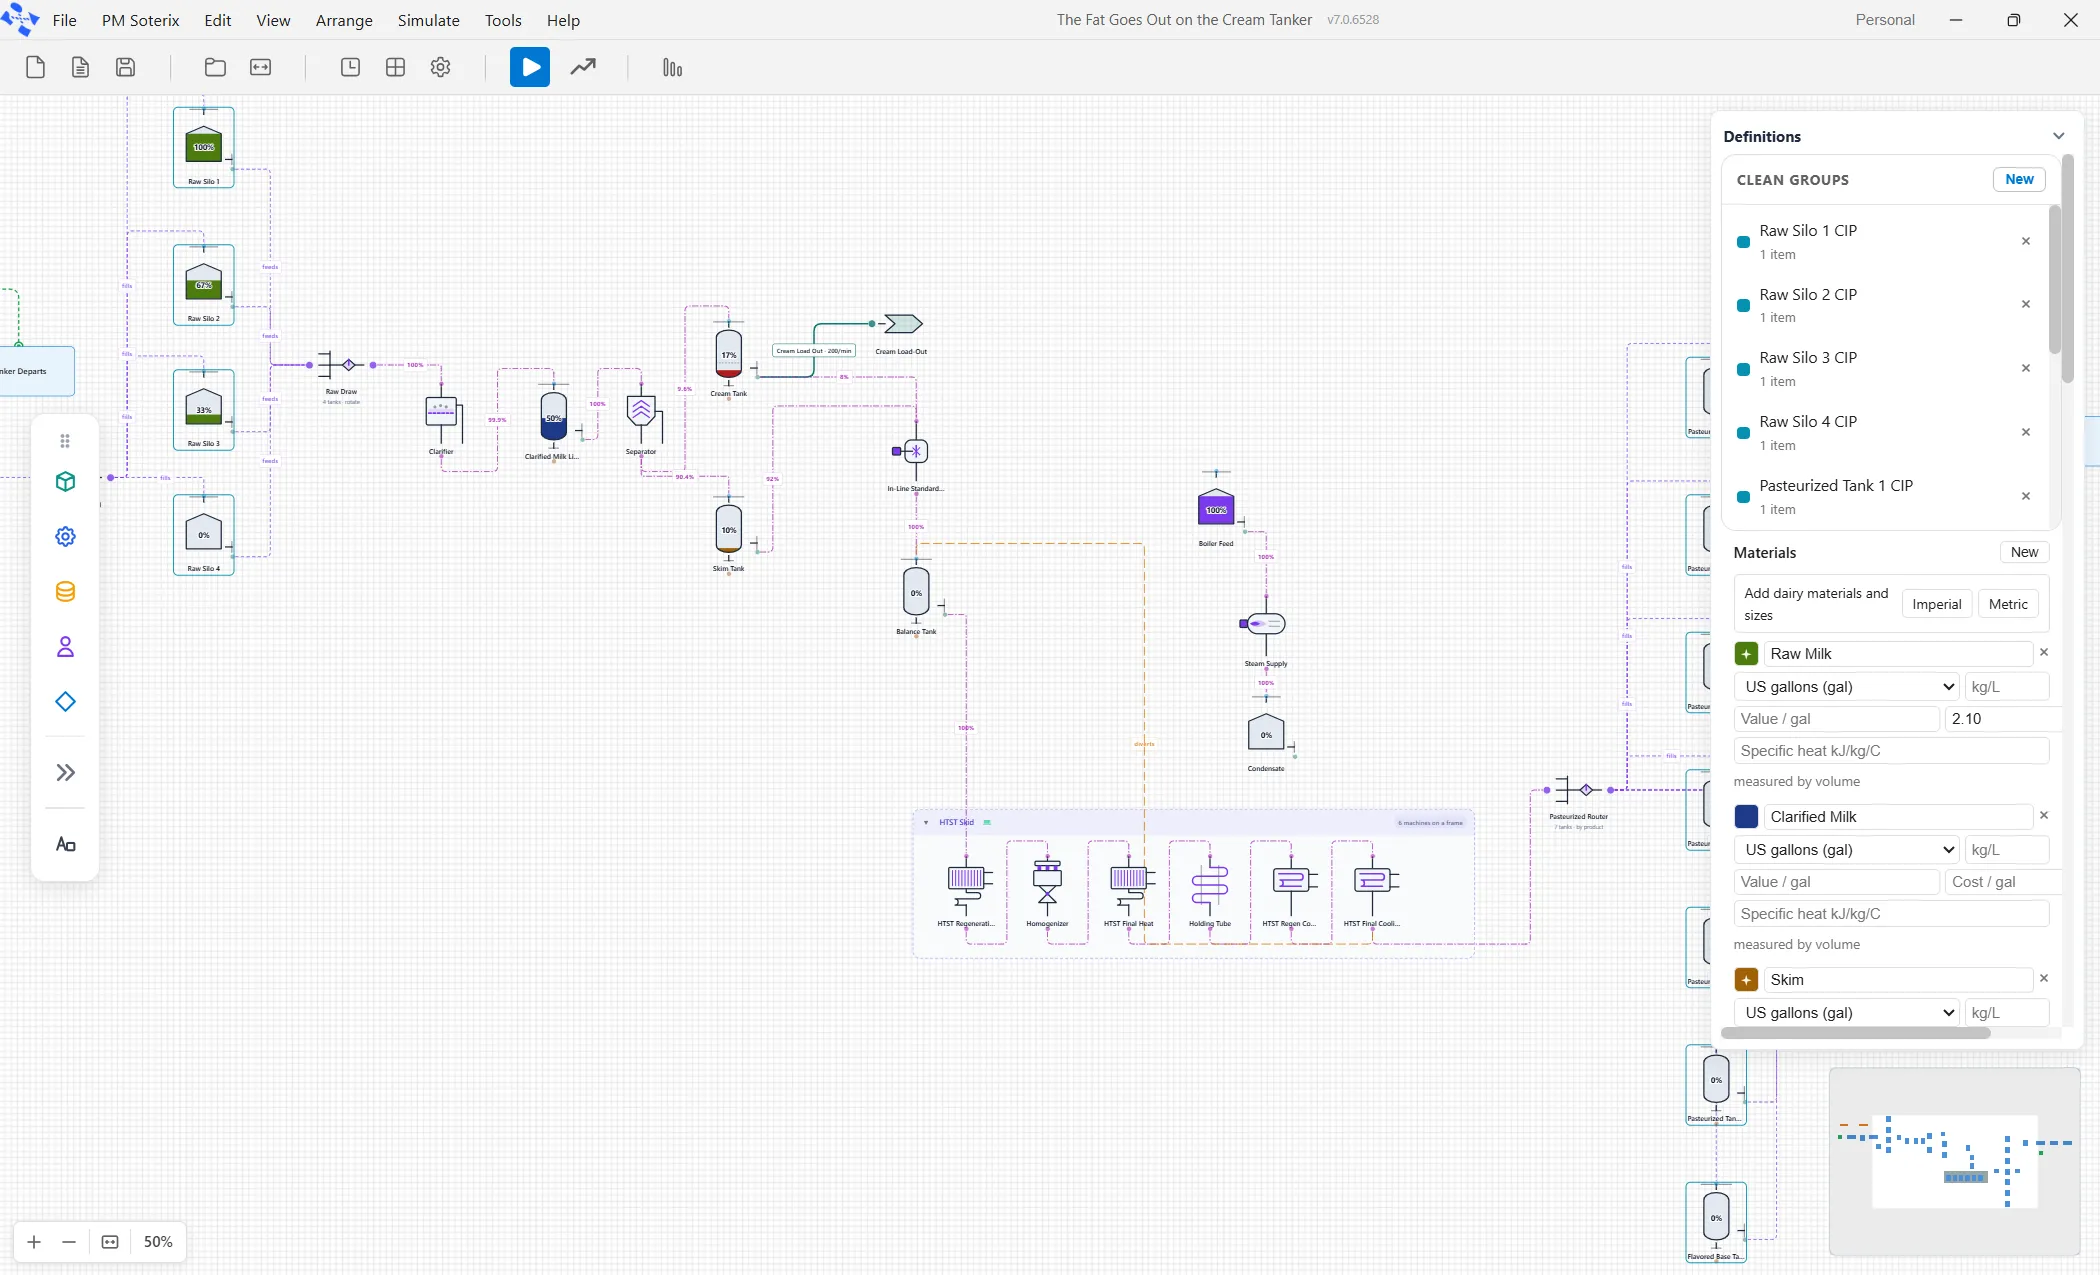
Tankers arrive via a “daily pattern” and unload through a Dumper into four raw silos. The milk is clarified, separated into cream and skim, standardized back to five fixed product ratios, pasteurized through a six-machine HTST skid, held for lab testing, and filled into gallons and half gallons. The butterfat the plant cannot bottle leaves on a cream tanker, and that stream is about five per cent of the volume and worth two and a half times a bottled gallon.
Things in it that are worth studying once the earlier four make sense:
| Feature | Where to look |
|---|---|
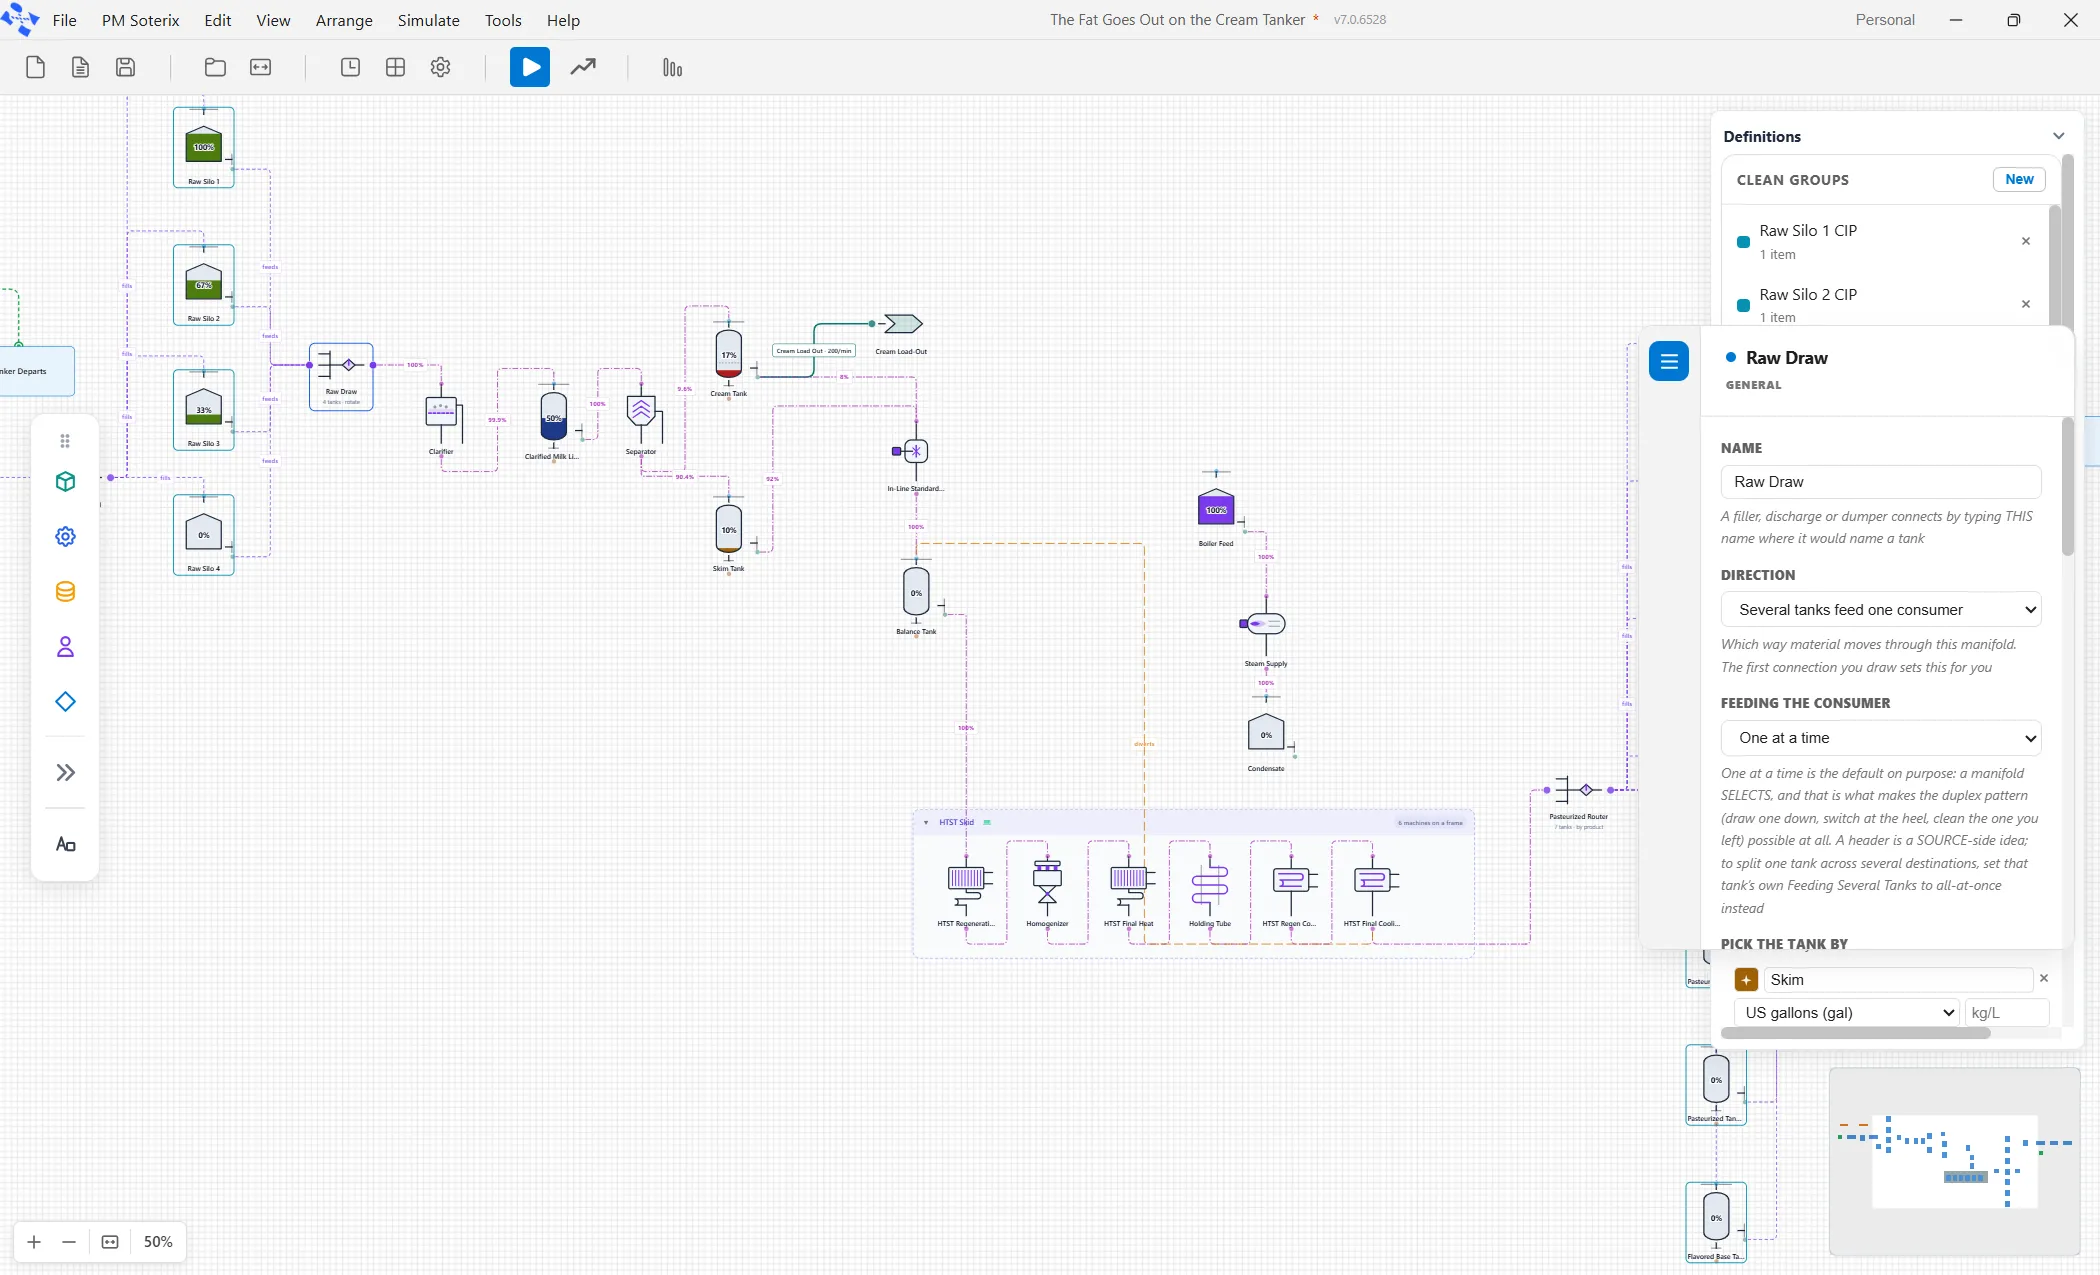
| Three manifold rules | Raw Receiving fills by priority; Raw Draw empties by rotation, which moves the scan start each time so the last silo is not stranded; the Pasteurized Router and Filler Draw both select by product from the run table. |
| Duty and standby washing | Every silo has its own clean group of one, and the Raw Draw manifold washes each on handover. Two members that wash on handovers may not share a group. |
| Recipes on a machine | The In-Line Standardizer carries five named recipes, one per product, each “a pair of skim and cream” proportions. |
| A transport delay | The Holding Tube carries a 15-second dwell: delivery lags the draw, and the material in transit is carried and drained forward. |
| A shared device | HTST Regeneration and HTST Regen Cooling both name the same device, Regen Pack, so failure takes out both halves. |
| A lab hold on a vessel | The pasteurized tanks each carry a hold time of T(50,60,70) minutes labeled Testing, so you can’t draw a tank until its lot passes. |
| Divert on a failure | The HTST Skid is a process group set to divert to the Balance Tank when the Steam Supply stops. |
| Ready-made what-ifs | Three scenarios ship with it: richer milk, demand at 110 percent, and a slower lab. |
Part 6. Reference
Section titled “Part 6. Reference”6.1 The elements, and what each need
Section titled “6.1 The elements, and what each need”| Element | Must have | Notes |
|---|---|---|
| Material | A name and a unit | Declare it first. The unit governs every quantity on every element that touches it. |
| Tank | Material, capacity | Plus initial level, heel, and up to four level marks. All literal numbers. |
| Transfer line | Both ends, material, rate | Connects two vessels or boundaries. Never an activity. Rate is a literal number. |
| Supply | A name | Material enters here and never runs out. |
| Delivery | A name | Material leaves here and never fills. |
| Unit Operation | Inputs, outputs, rate | Continuous or batch. Outputs are percentages that must account for everything. |
| Manifold | Direction, rule, members | Sources or destinations; priority, by level, rotate, or by product. Members share a material. |
| Filler | A vessel, entity type, rate, size | Size takes a container format by name, which is the safe answer. |
| Discharge | A vessel, entity type, rule | All, down to heel, or a fixed quantity. Fired with DISCHARGE(“name”). |
| Dumper | A vessel, rate | Entities route in. Choose whether the emptied container continues or is consumed. |
| Clean group | Members, duration | Duration accepts an expression. Members are vessels, activities, and resources. |
| Setup group | Members, a product matrix | Triggered by the change of product. Not a flag on a clean group. |
6.2 Mistakes that cost an afternoon
Section titled “6.2 Mistakes that cost an afternoon”Joining two tanks with an ordinary routing arrow. The model draws, runs and reports, and moves nothing. Material moves on pipes.
Leaving a second inlet at the default priority. It can move nothing at all during the run, and nothing warns you. See 5.4.
Putting a variable in a tank capacity or a pipe rate. Those fields take literal numbers only. Change the number between runs, or use a scenario.
Renaming a tank or a pipe after wiring it. Pipes find vessels by name, and the valve commands take names in quotes, so a rename orphans every reference while looking fine.
Reading the opening page of the report and concluding the model did nothing. A fluid model’s output is on Advanced, then Bulk.
Expecting Starved to mean nothing moved. It means the source could not keep the pipe at its rated speed. Read % of Nameplate beside it.
Making up a capacity, a rate or a wash time. A visible gap is better than an invented number, because the invented one gets trusted.
6.3 What a fluid model does not assert
Section titled “6.3 What a fluid model does not assert”Worth saying out loud to anyone who will act on the results. These models are strong on vessels, pumps, duty and standby rotation, fixed ratio splits and blends with exact mass accounting, filling run lists with changeovers, and washing. They are not a chemistry or thermal simulator and never claim to be.
No temperature is simulated anywhere. Heating and cooling are rates and times.
No pressure, pH, concentration, viscosity, Brix, fat, or solids percentage.
No reactions and no composition. A split is a ratio you supplied.
Mixed dimensions in one operation are refused. Liters cannot flow into a vessel measured in kilograms without a density to bridge them.
6.4 The five models, and what each is for
Section titled “6.4 The five models, and what each is for”| Model | Read it for |
|---|---|
| Waiting on the Vat | A heated vessel, level marks, OPENLINE and CLOSELINE, and driving a fluid plant from a discrete control loop. |
| The Whey Takes the Volume | The Unit Operation, a one-to-two split, a clean group, and an all-fluid model with no entities. |
| The Colours Run in Order | Supply, Filler, container formats, a run table, manifolds selecting by product, and setup groups. |
| QA Hold and Batch Release | Discharge and Dumper, the seam between fluid and discrete, and pipe priority. |
| The Fat Goes Out on the Cream Tanker | A whole plant: three manifold rules, recipes, a transport delay, a shared device, a lab hold, divert on failure, and scenarios. |
List of figures
Section titled “List of figures”- Figure 1. The welcome screen. Blank Canvas starts an empty model; the cards below it open examples.
- Figure 2. An empty canvas. The floating palette on the left holds the general elements; the fluid ones arrive with the industry palette.
- Figure 3. File, then Demo Models. The industry list filters the cards. All five fluid models are filed under Manufacturing.
- Figure 4. A pipe’s settings. The note under Rate states the literal number rule in the product’s own words.
- Figure 5. View, then Show Industry Palettes.
- Figure 6. The Dairy face. Each tile carries a one-line description of what the element is for.
- Figure 7. The Machines section. Every one of these drops the same Unit Operation element with different settings.
- Figure 8. The Definitions panel. Materials sits at the top; the Dairy face also offers a ready made set of dairy fluids and pack sizes.
- Figure 9. A vessel’s settings. Name, material and capacity are the three that matter here.
- Figure 10. Simulate, then Options. Run length 480 minutes, one replication, animation off.
- Figure 11. The completion card. It reports zero entities, which is correct here and explained in Part 4.
- Figure 12. The finished model. Each pipe carries its name and rate.
- Figure 13. The report opens on the trust question. For a model with no entities in it, the headline problem is expected.
- Figure 14. The top of the Bulk tab: levels over time, the mass balance, and the start of the Tanks table.
- Figure 15. The Transfer Lines table. Silo Draw is the only pipe at 100 per cent of nameplate.
- Figure 16. Waiting on the Vat. A silo, a vat, a pasteurized tank, a delivery, and a four step control loop above them.
- Figure 17. The Whey Takes the Volume. A cheese make room with no discrete elements anywhere in it.
- Figure 18. The Colours Run in Order. A ceramic paint line running six colors through four holding tanks.
- Figure 19. A Filler’s settings, from this model.
- Figure 20. QA Hold and Batch Release. The bulk plant is on the left; everything to the right of the Discharge is ordinary discrete flow.
- Figure 21. The Fat Goes Out on the Cream Tanker. Receiving on the left, the HTST skid in the middle, the pasteurized tanks and filler on the right.
- Figure 22. The Raw Draw manifold from this model: four tanks, rotate.
- Figure 23. A Unit Operation’s settings, taken from The Whey Takes the Volume.