

Daily Pattern Arrival
A daily pattern arrival models a recurring weekly volume, shaped across the hours of each day, so busy and quiet periods repeat week after week with realistic variation.
Building a pattern
Section titled “Building a pattern”Open the Daily Pattern Builder. For each weekday you set:
- Day quantity: how many entities arrive that day (a number or a distribution, so the total varies week to week).
- A 24-hour curve: the share of the day’s total that arrives in each hour. Shape it with a preset (Flat, Business hours, Morning peak, Evening peak, Bimodal) or edit the hours directly; the curve totals 100%.
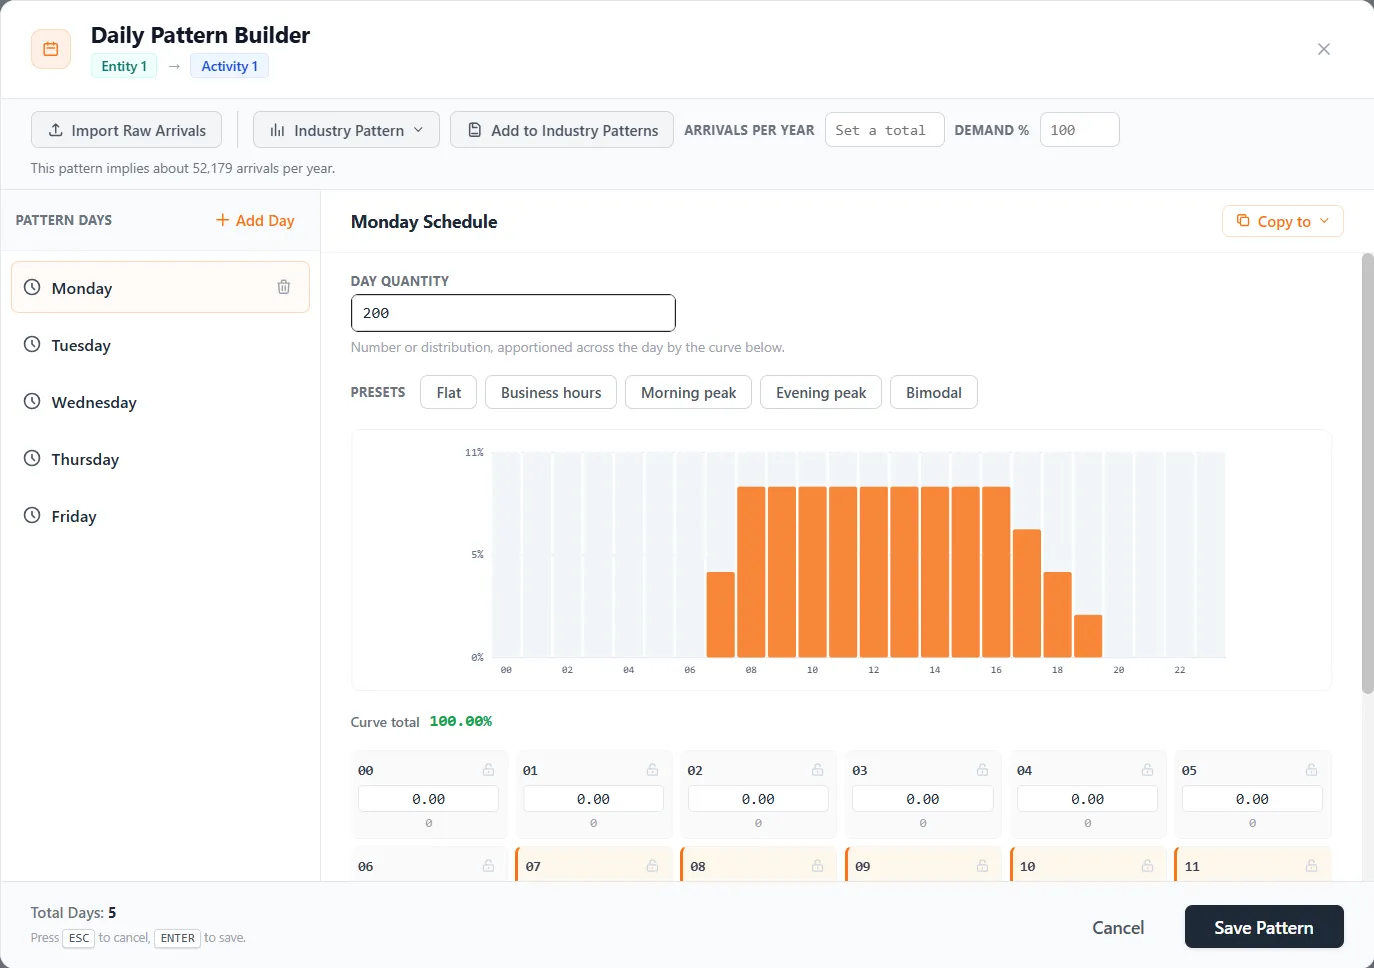
Each week, ProcessModel samples the day’s quantity fresh, spreads it across the hours by the curve, and places each hour’s arrivals at random moments within that hour. Sampling the quantity every week is what keeps run-to-run variation realistic.
The Pattern Days list on the left holds the days of the pattern, and the delete mark on a day removes it. Add Day offers the weekdays that are not in the list yet, and is not shown once all seven are in. With a day selected, Copy to copies its quantity and curve to All days or to one other day.
Scaling the whole pattern
Section titled “Scaling the whole pattern”Arrivals per year and Demand % sit side by side in the builder’s toolbar, and they are the same change written two ways. Type a yearly total and every day is scaled by the same factor. Type a percent and the pattern becomes that share of what it held when you opened the builder: 125 makes every day a quarter bigger, and 100 puts it back. The shape of the week stays, and so does each day’s distribution, with its spread scaled to match. A day written as a fixed number becomes a Poisson distribution around the new number.
The percent is saved with the model, so a pattern saved at 125 reopens showing 125. A later 150 is 150 percent of the original, not of the raised pattern, and editing a day by hand starts a fresh baseline at 100. Either way you change the pattern itself when you save. To try a volume without changing the model, use a scenario.
Industry Patterns
Section titled “Industry Patterns”A curve preset shapes the hours of one day. An Industry Pattern fills all seven days at once: the day-of-week split and every day’s hourly curve, in one step.
Open the Industry Pattern list in the builder’s toolbar. Each entry shows its name and the yearly arrival total it ships with, and hovering an entry previews its shape before you apply it. Two emergency department profiles ship with ProcessModel:
| Pattern | Shape of the week |
|---|---|
| Detroit Inner-City ED | Heavy throughout, with a late afternoon and evening peak, and weekends busier than weekdays |
| Rural Hospital ED | Quieter, weighted to mid morning, with weekends lighter than weekdays |
Picking one replaces every day in the pattern, so you are asked to confirm first if you have already built one. The pattern’s own yearly total lands in Arrivals per year beside the picker. Overtype that with your real figure and every day rescales by the same factor, leaving the shape of the week untouched.
Saving your own
Section titled “Saving your own”Add to Industry Patterns stores the seven days on screen, with their quantities and their hourly curves, under a name you choose. It joins the list straight away, and it is kept on your computer rather than inside the model, so every model you open on that machine can reach it.
- Your own patterns are marked SAVED in the list and carry a delete control. The two that ship with ProcessModel do not, and cannot be removed.
- Saving under a name that already exists replaces that entry, which is how you retune a pattern to your own numbers. You are told before it happens.
- Save under the name of a shipped pattern and yours takes its place in the list. Delete yours and the original comes back.
Importing from raw data
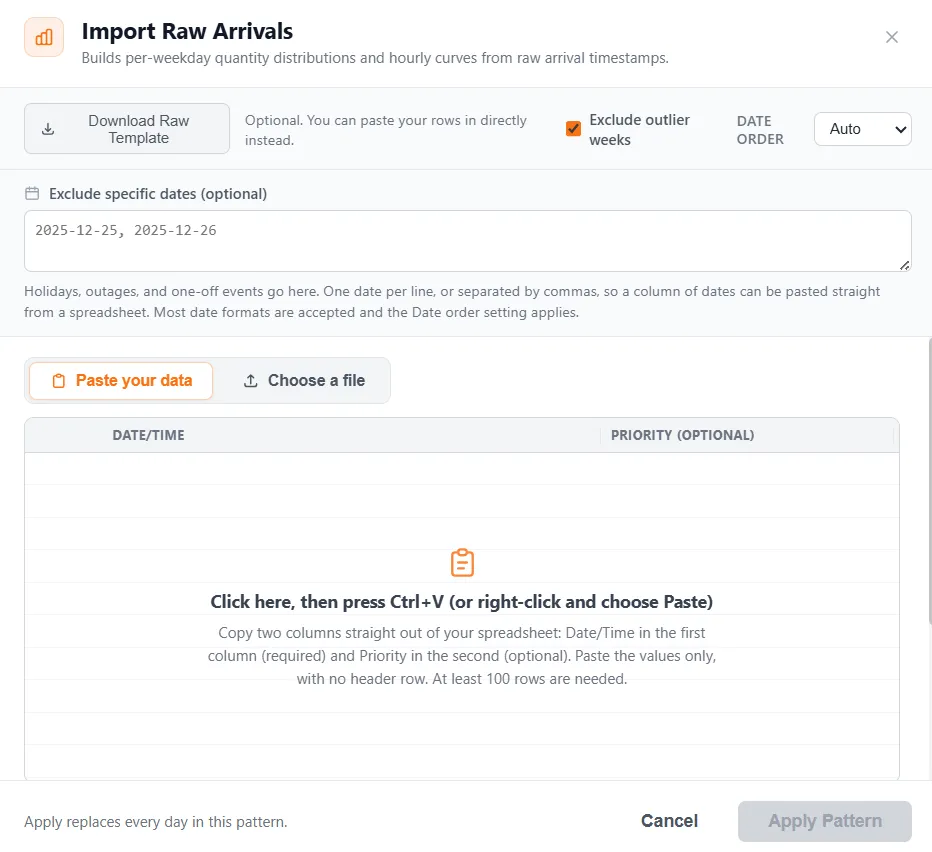
Section titled “Importing from raw data”Import Raw Arrivals turns real timestamps into a fitted pattern for you. It reads one row per arrival, with the date and time in the first column and an optional priority level in the second, and it needs at least 100 rows before it will fit anything.
Supply the data either way. Paste your data takes rows copied straight out of a spreadsheet, and Choose a file takes an Excel or CSV file. Download Raw Template saves a starter sheet if you would rather begin from one.
Settings that change the fit
Section titled “Settings that change the fit”- Date order decides how an ambiguous date like 03/04/2025 is read. Auto works the order out from the data itself; MM/DD and DD/MM force it when the data cannot settle the question on its own.
- Exclude outlier weeks drops weeks whose totals are numerically extreme before fitting, so one holiday week or a collection glitch cannot drag a whole weekday’s quantity off.
- Exclude specific dates drops arrivals on calendar days you name, such as holidays, an outage, or a one-off event. It is a separate control from the outlier filter: that one finds extreme weeks by arithmetic, this one removes days you already know about. A date that cannot be read, or that turns out to have no arrivals, is reported back rather than quietly ignored.
Changing any of these re-derives the pattern from the rows already loaded, so you never have to supply the data again.
Reading the result
Section titled “Reading the result”Weekly Variability sits above the results and is a read-only chart, not a setting. Each column covers one weekday’s weekly totals, and all seven weekdays are drawn on a single shared scale so you can see at a glance which days are steady and which swing. The box spans the middle half of the weeks, the line is the median, and the whiskers reach the lowest and highest week. The percentage under each weekday is its share of a typical week. Show weekly data underneath opens the counts the chart is drawn from, one row per week and one column per weekday, with a total and a share for each.
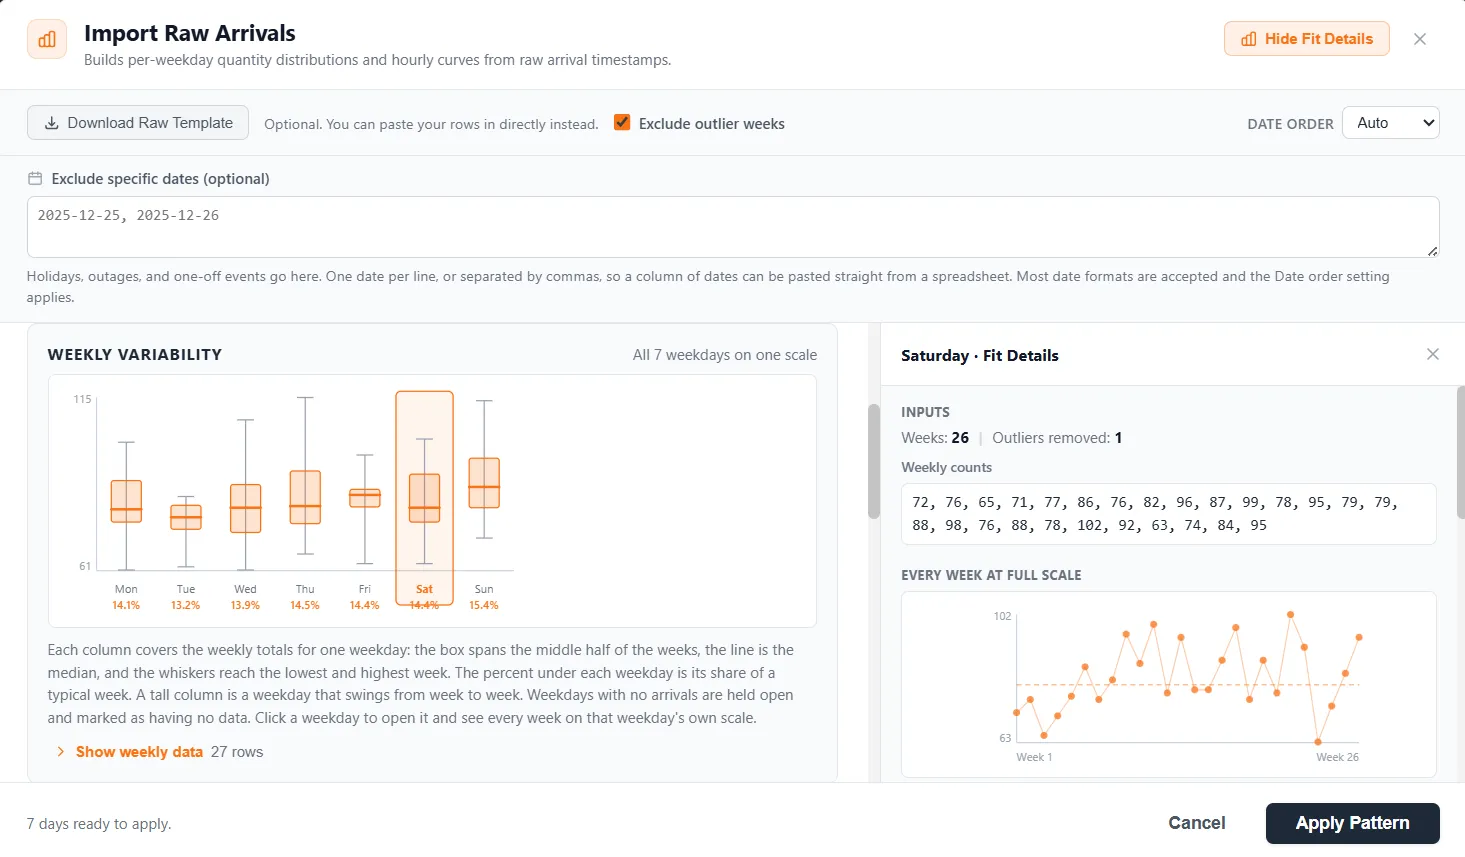
Below it there is one row per weekday:
| Column | What it holds |
|---|---|
| Weekday | The day. Click it to open Fit Details for that day. |
| Quantity | The day quantity chosen for you. The list holds the five best fits, best first, each with its goodness-of-fit score. |
| Weeks | How many weeks of that weekday the fit ran on. |
| Hourly curve | The 24-hour curve, taken from when arrivals actually landed on that day. |
A weekday with fewer than five weeks of data is marked fallback: there is not enough history to fit a distribution, so its quantity is seeded from the sample mean instead. Choosing Custom on any row sets that day aside from the fit entirely and lets you type a plain number or a distribution of your own.
Fit Details
Section titled “Fit Details”Show Fit Details opens a pane for the weekday you clicked, and this is where the numbers behind the chosen quantity live.
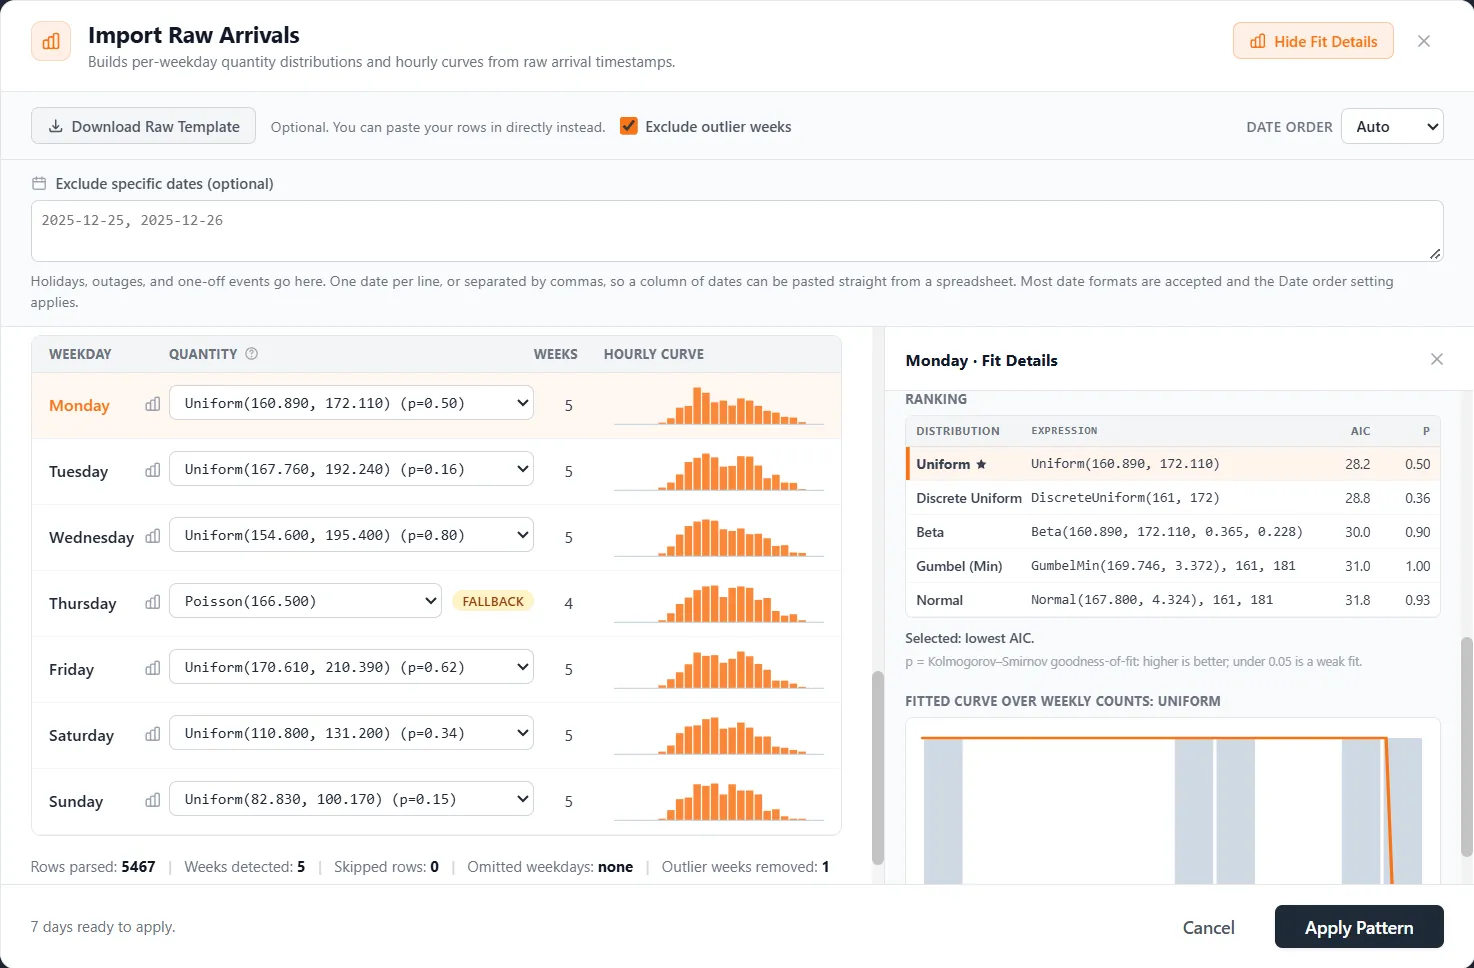
- Weekly counts lists the arrival totals the fit ran on, week by week.
- Every week at full scale plots those same counts on that one weekday’s own scale, so a busy day’s week-to-week spread fills the panel instead of being a few pixels tall on the shared scale above. Beside it are the weekday’s minimum, quartiles, median, maximum, mean, and its share of the week.
- Ranking lists the five best-fitting distributions for those weekly counts, best first. Distribution names the family, Expression is what the day quantity will actually be set to, AIC balances how closely a family fits against how many parameters it needs, and p is a goodness-of-fit score where higher is better and anything under 0.05 is a weak fit. The lowest AIC wins and is chosen for you, and you can pick any other row from the Quantity list instead.
- Fitted curve over weekly counts draws the chosen distribution over the real counts, which is the quickest way to judge whether the fit is believable.
Priority
Section titled “Priority”If your data carries a second column of priority levels, the import writes one piece of global action logic that assigns a priority attribute to arriving entities in the same mix your data showed. Level mix beside it is a read-only chart of that observed mix, so you can check the split before you apply anything.
Applying
Section titled “Applying”The counts under the grid report how many rows parsed, how many weeks were detected, how many rows were skipped, which weekdays had nothing in them at all, and how much the two exclusion settings removed. Apply Pattern then replaces every day in the pattern.
Your raw data travels with the model, so View Import Analysis in the builder’s toolbar reopens the whole analysis later with every chart live.
Action logic
Section titled “Action logic”A daily pattern arrival has a single Global action logic that runs for every entity the pattern creates.
LegacyHow this worked in the previous version
A daily pattern arrival shows the rate at which entities arrive for different time periods during the day. Arrivals are assumed to occur randomly within each period. The pattern for each day of the week can be different from the others.
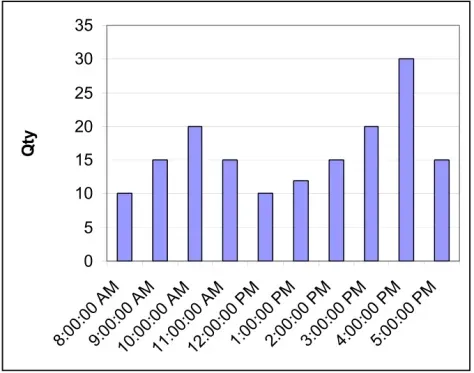
If a shift file has been defined for the activity where entities arrive, it is a good idea to synchronize the arrival periods with the activity schedule.
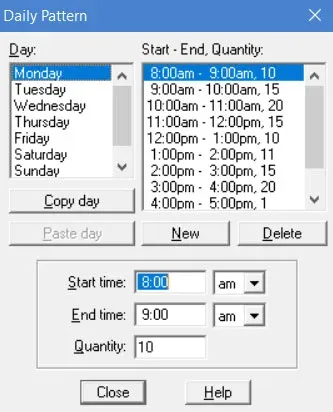
As displayed after the pattern for Monday has been defined
**Day **The list of days of the week. A pattern may be defined for each day.
Start - End, Quantity The list of period entries showing the start time, end time, and quantity of entities to arrive during that period for the day currently selected.
Copy day Button to copy a day’s pattern in order to paste it later on another day. Prevents tedium of entering the same periods for each day of the week that has the same arrival pattern.
Paste day Once a day has been copied, the Paste button becomes active and lists the name of the day that will be copied in the button itself. Select another day in the Day list and press the button to paste the pattern into the new day.
**New **Creates a new period entry in the Start - End, Quantity list with default times and quantity. The order of the new entry in the list will automatically be adjusted to maintain a chronological list.
**Delete **Removes an arrival period from the list.
Start time The start time edit field for the currently selected period.
**End time **The end time edit field for the currently selected period.
**Quantity **The quantity edit field for the currently selected period. Any valid expression may be used.
- Time entries for a Daily Pattern many not overlap (Correct example: Monday 8:00-9:00, 9:00-10:00. Incorrect example: Monday 8:00-9:00, 8:30-9:30 - these time slots overlap).
How To - Define a daily pattern
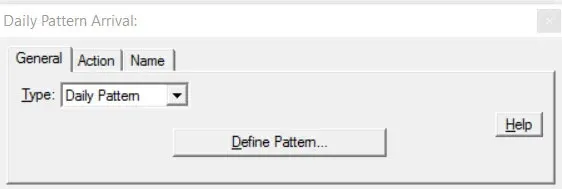
Section titled “How To - Define a daily pattern”- Click on the Define Pattern button to display the Daily Pattern dialog.
- Click the New button to create a new entry in the pattern dialog. This creates the Monday 8:00am - 9:00am, 1 default entry. (The quantity and times may be changed as desired.)
- Repeat step 2 for each time period to be defined in which arrivals occur.
- Once a particular day’s pattern has been defined, you can copy the pattern to another day by selecting the defined day, clicking on the Copy day button, then selecting the day to which the pattern will be copied and clicking the Paste button. (The name of the weekday appears on the Paste button, so you will know which day is being copied.)
A Note About Time
Section titled “A Note About Time”When you use the Daily Pattern arrival or Scheduled Arrival, you must understand that statistics, especially resource statistics, may be affected due to the way the clock works in ProcessModel. Each ProcessModel simulation begins at 12:00 a.m. (midnight) on Monday morning of the first week. Therefore, Daily Pattern or Scheduled arrivals may skew statistical results, especially with regard to resource and input and output queue utilization. The solution is the use of Shifts in conjunction with your Daily Pattern or Scheduled arrivals. For more information see Schedules-Shifts & Breaks.