

ProcessModel 7 Self Teach GuideChapter 1
Chapter 1. Welcome and the Window
By the end of this chapter you can
Find your way around ProcessModel and run your first demo model.
Before you start
Welcome to the Self Teach Guide. It has fifteen chapters, and from Chapter 2 on you build one model, a phone repair shop, that grows a little in every chapter. Each chapter has a short video, this written lesson, a practice model, three questions to check yourself and one small task to try on your own.
This first chapter builds nothing. Its job is to make the window familiar, so that later chapters can talk about the toolbar, the palette or a shape’s properties and you know at once where to look. You do that the best way there is: by opening a finished model, looking inside it, and running it.
You need ProcessModel installed on your computer (see System requirements) and about twenty minutes. A trial, a student license or a Professional license all work the same for this course.
How to use this lesson. Keep ProcessModel open beside this page and do each step as you read it. After each step, the lesson tells you what you should see. If your screen does not match, stop and look again before moving on: the small things you notice now save you time in every later chapter.
Step 1. Start on the Welcome screen
Start ProcessModel. It opens on the Welcome screen, the place where every session begins: you start a new model here, or pick up one you worked on before.
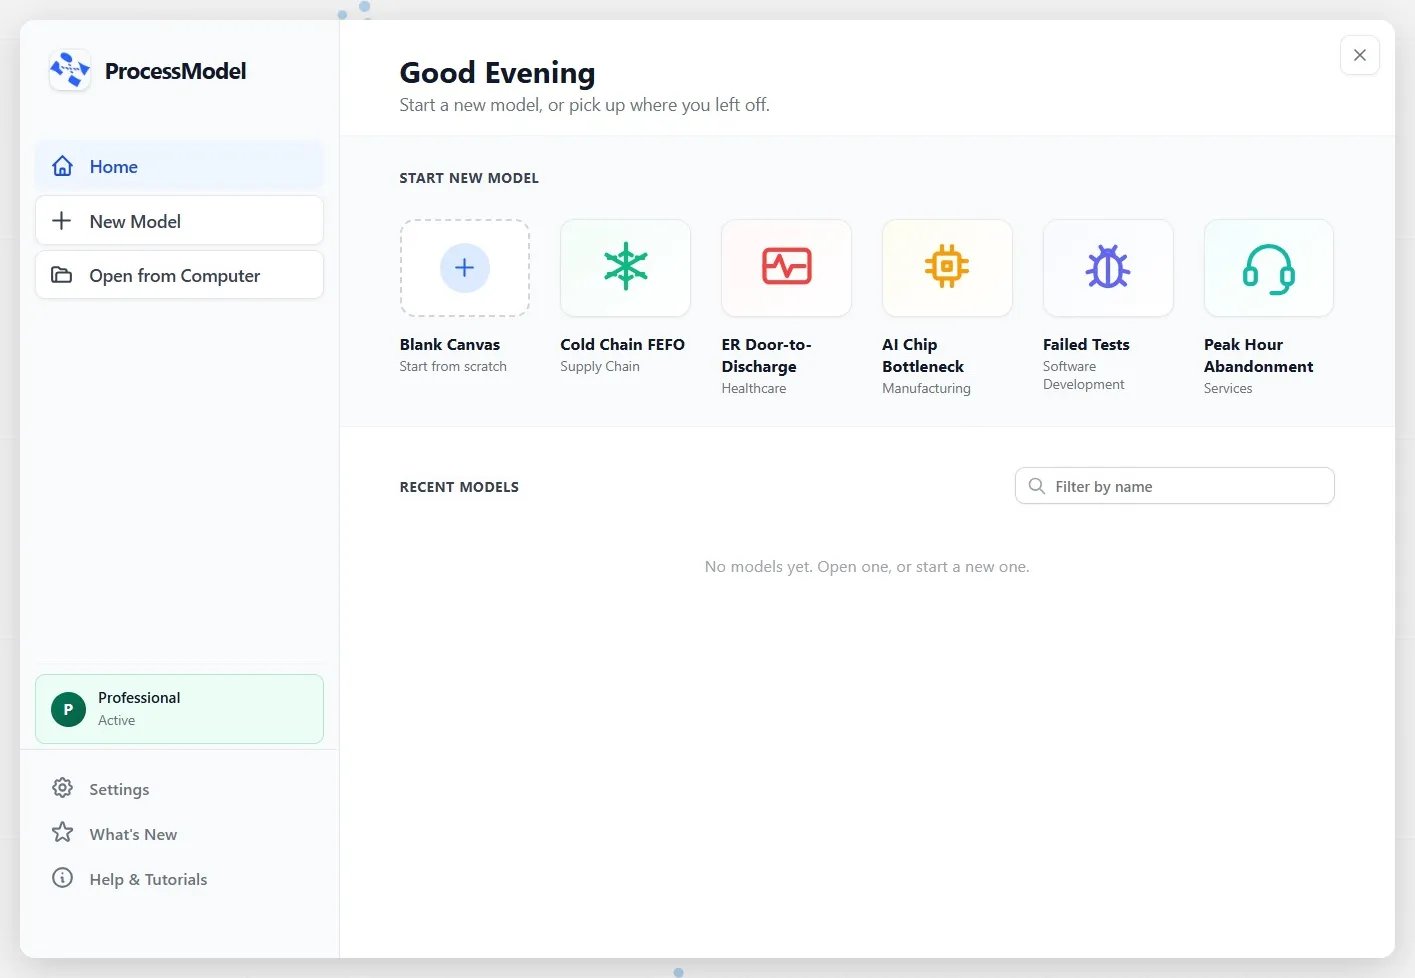
What you should see: a greeting that follows the time of day, a row of tiles under Start New Model, and a Recent Models list. On a first start the list is empty; it fills as you save models.
Step 2. Read the left list and your license
The list down the left side is your way into everything the Welcome screen does. Rest your eyes on each row:
- Home is the screen you are looking at.
- New Model starts an empty model.
- Open from Computer opens a model you saved earlier.
- The green row shows your license. In the picture it reads Professional; yours may read Trial or Student. It only reports: it is there so you always know which license you are working under.
- Settings, What’s New and Help & Tutorials sit at the bottom.
Your license also shows at the top right of the window, in the title bar, so you can see it even after the Welcome screen is gone.
Now look at the tiles. Blank Canvas starts an empty model; you will use it in Chapter 2. The other five are finished demo models, each from a different industry. The last one, Peak Hour Abandonment, is a call center, and it is the model this chapter opens. You will not open it from the tile, though: you will open it from Demo Models, the library where all the demos live, because that is where you will find the course’s practice models from Chapter 3 on.
Step 3. Open Demo Models
- Close the Welcome screen with the X at its top right. You see an empty canvas, ready for a model.
- Click File in the menu bar, then Demo Models.
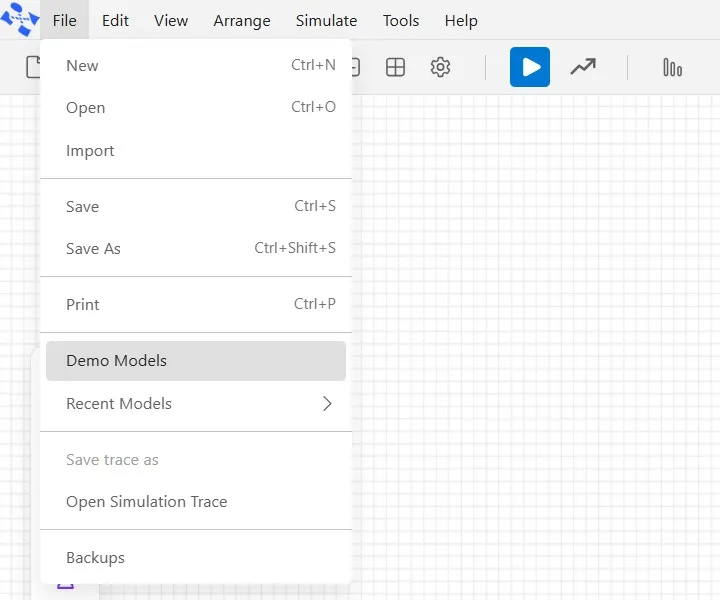
There is a second way in: the toolbar under the menus has a Demo Models button. Rest the pointer on any toolbar button and its name shows, which is the quickest way to learn them.
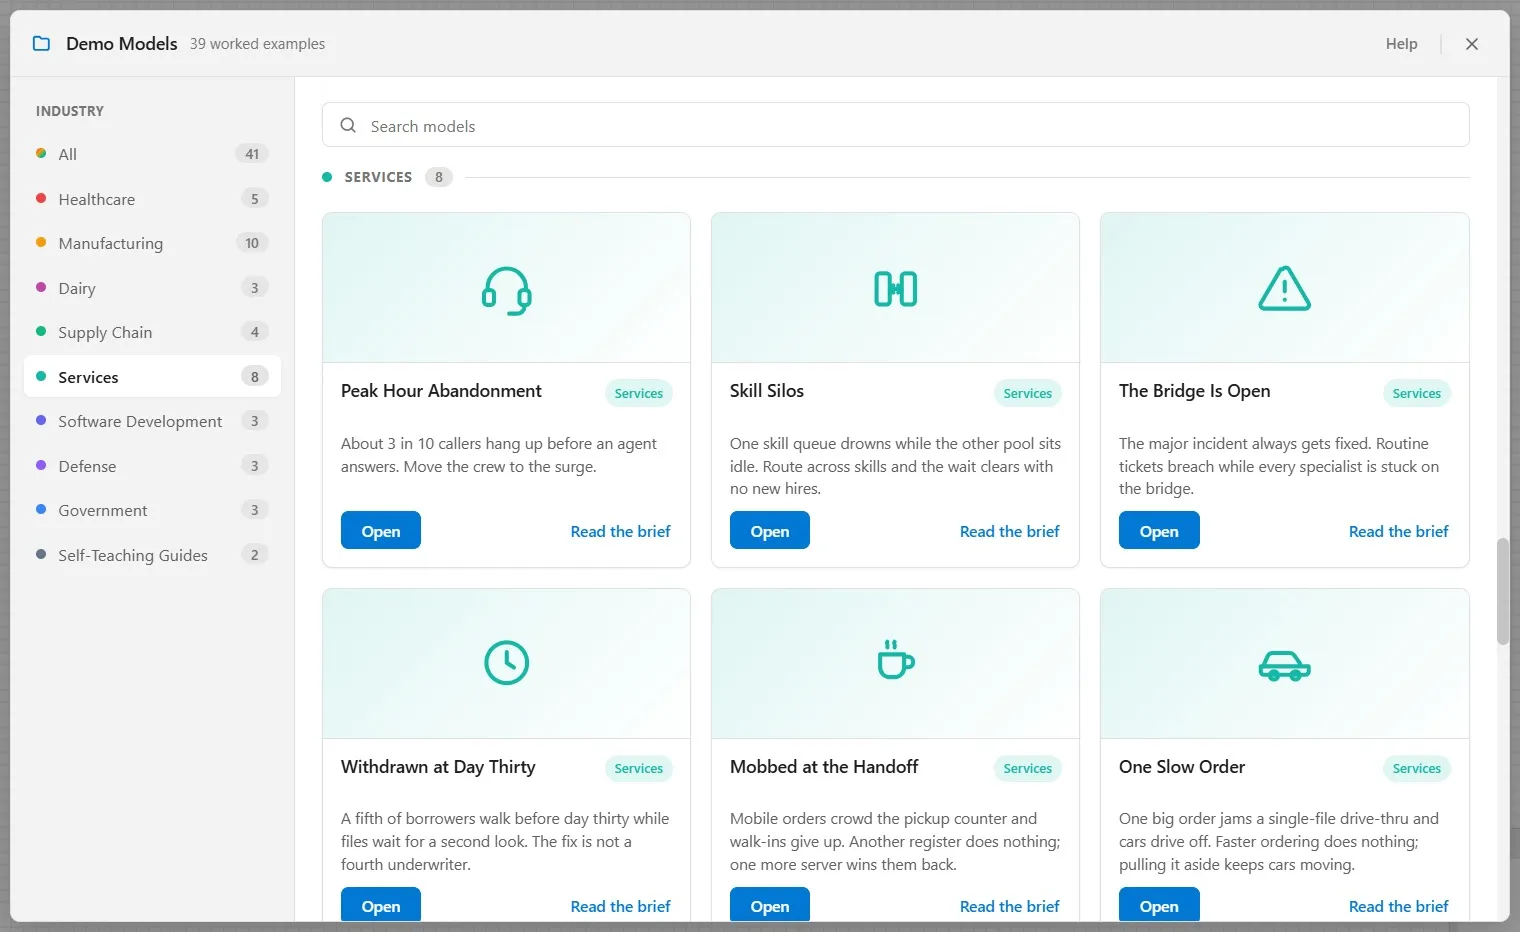
What you should see: the Demo Models window. Down its left side is a list of industries; on the right, a card for each demo.
Step 4. Read the brief, then open the model
Every demo is a finished model built around one problem. Reading the problem first is the habit that makes a model make sense: you know what it is for before you look at how it is built.
- In the list on the left, click Services. The cards jump to the services demos.
- Find the Peak Hour Abandonment card. Its line tells the problem in one sentence: about 3 in 10 callers hang up before an agent answers.
- Click Read the brief on that card.
The brief opens beside the cards. It tells you the problem, how the model is set up, and what to try. Read it now: it takes a minute, and it is the story behind everything you are about to see.
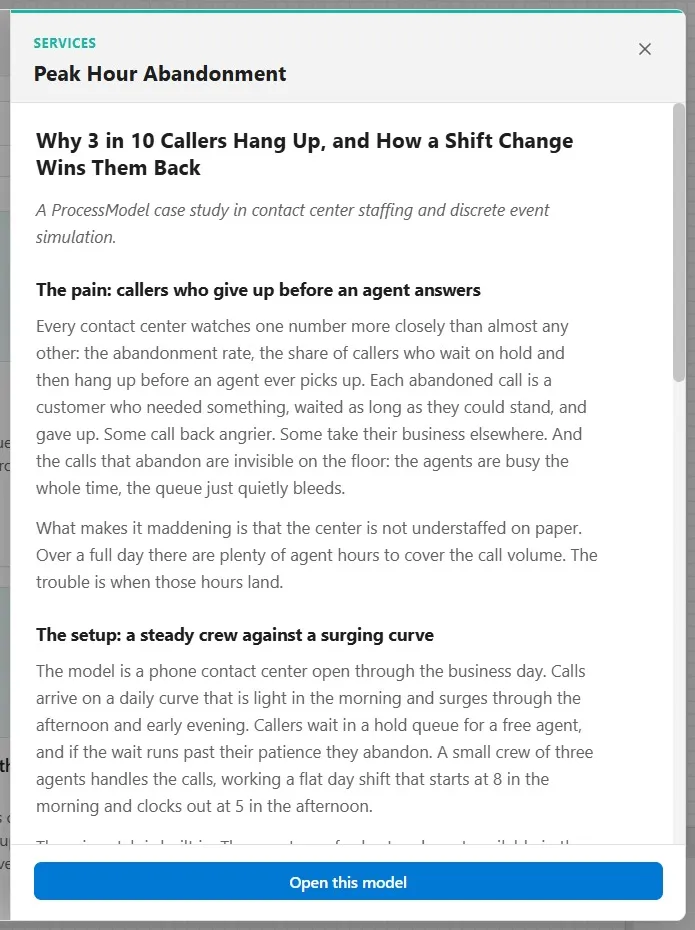
- Click Open this model.
What you should see: the call center on the canvas, with its name, Peak Hour Abandonment, in the title bar. A demo always opens as a new model, so whatever you change, the original in Demo Models never changes. You can explore freely.
Step 5. Learn the four parts of the window
Now take in the whole window. Everything you do in ProcessModel happens in one of four places, and every later chapter names them.
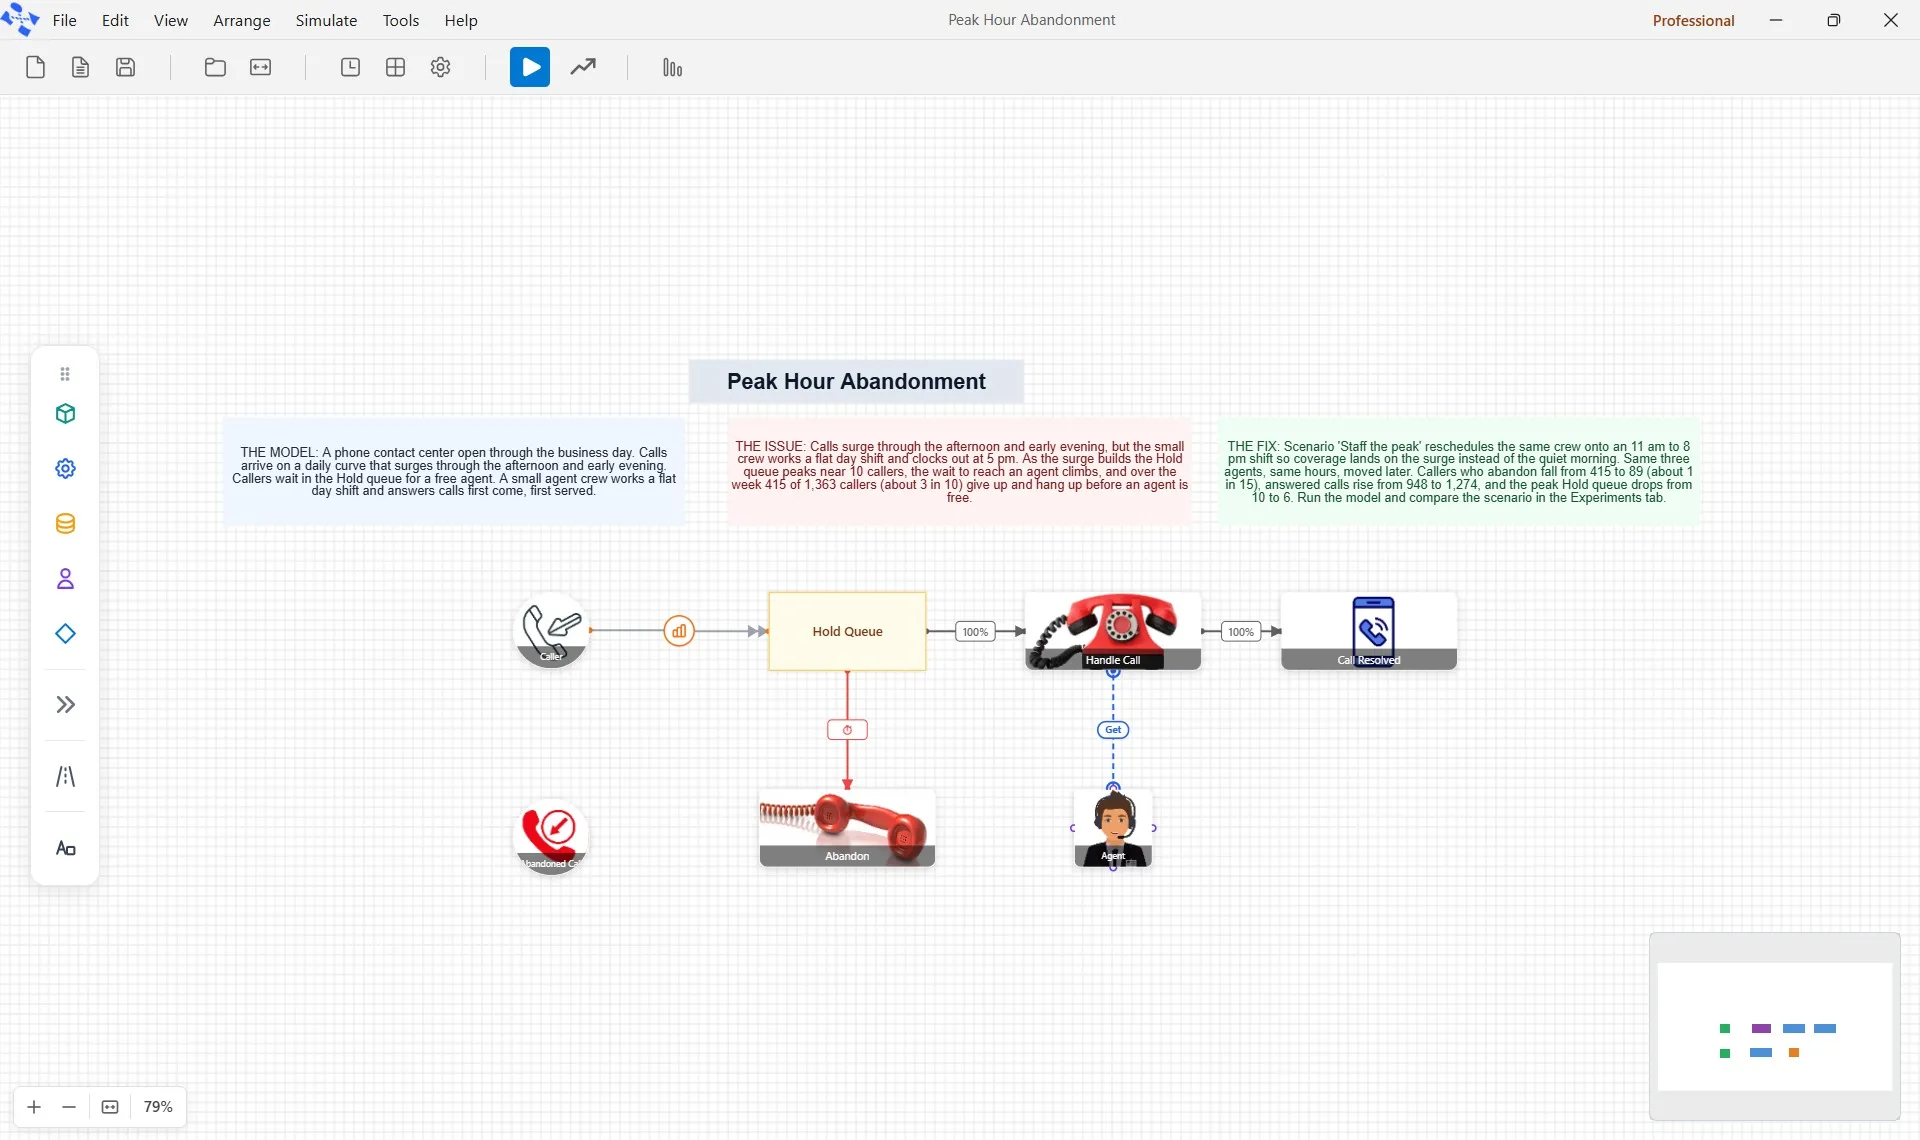
- The menus across the top: File, Edit, View, Arrange, Simulate, Tools and Help.
- The toolbar under them holds the commands you use most, one click each: from New Model and Demo Models to Simulation Options, Run Simulation and the Output Report. Rest the pointer on a button to see its name.
- The palette runs down the left side of the canvas. It holds the shapes you drag in to build a model: entities, activities, queues, resources and more. Its buttons name themselves the same way when you rest on them.
- The canvas is the rest of the window, where the model is drawn.
Read the canvas from left to right, the way the work flows. Callers arrive, wait in the Hold Queue until an agent is free, and are handled at Handle Call. A caller who waits too long hangs up and goes to Abandon instead. The Agent under Handle Call is the people who take the calls. The three notes above the flow tell the same story as the brief.
Step 6. Open a shape’s properties
A shape on the canvas is only a picture until you look at its properties: the settings that tell ProcessModel how that part of the process behaves. Every shape keeps its settings in the same place.
- Double-click in the middle of Handle Call. Its properties open on the right.
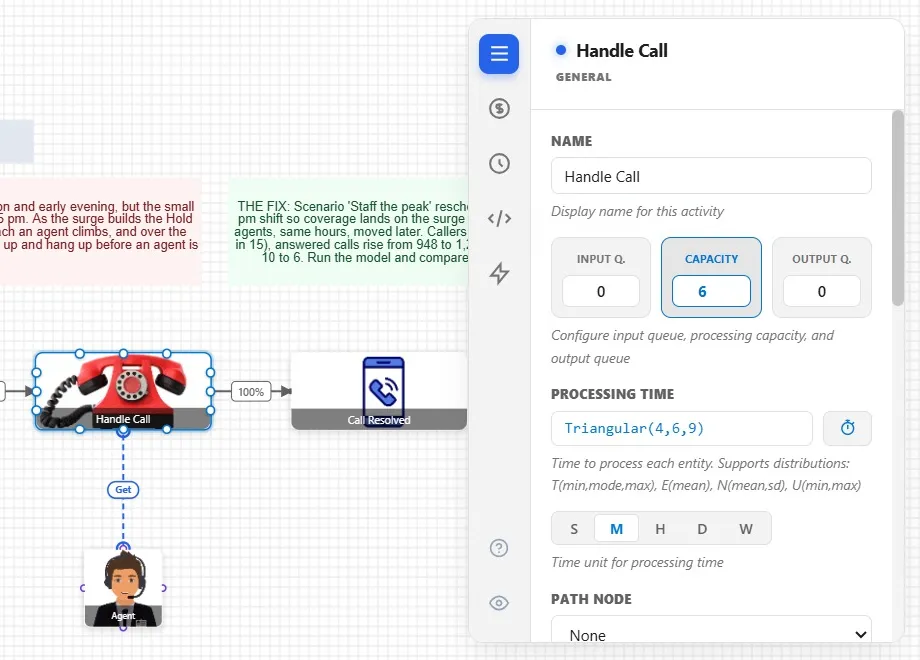
Handle Call is an activity, a step where work is done. Three of its settings carry most of its meaning:
- Name is what the shape is called on the canvas and in the results.
- Capacity is how many calls it can handle at the same time.
- Processing Time is how long each call takes. The unit row under it says what the number means: M is chosen, so the time is in minutes.
- Click an empty part of the canvas. The panel closes.
- Now double-click Agent, under Handle Call. Agent is a resource: the people (or machines) an activity needs. Its panel shows its Name and its Quantity, how many agents there are.
- Click the empty canvas again to close it.
Why this matters: from Chapter 2 on, you set these values yourself. Knowing that every shape opens the same way, with a double-click, and closes with a click on empty canvas, is most of what you need to work with any shape.
Step 7. Run the model five times
A model earns its keep when it runs: ProcessModel plays the process forward through time and counts what happens. You will run this one five times, not once. Calls come in at random, so one run is one possible week; five runs average out that chance. Chapter 10 explains why in full. For now, it is enough to know that more than one run gives an answer you can lean on.
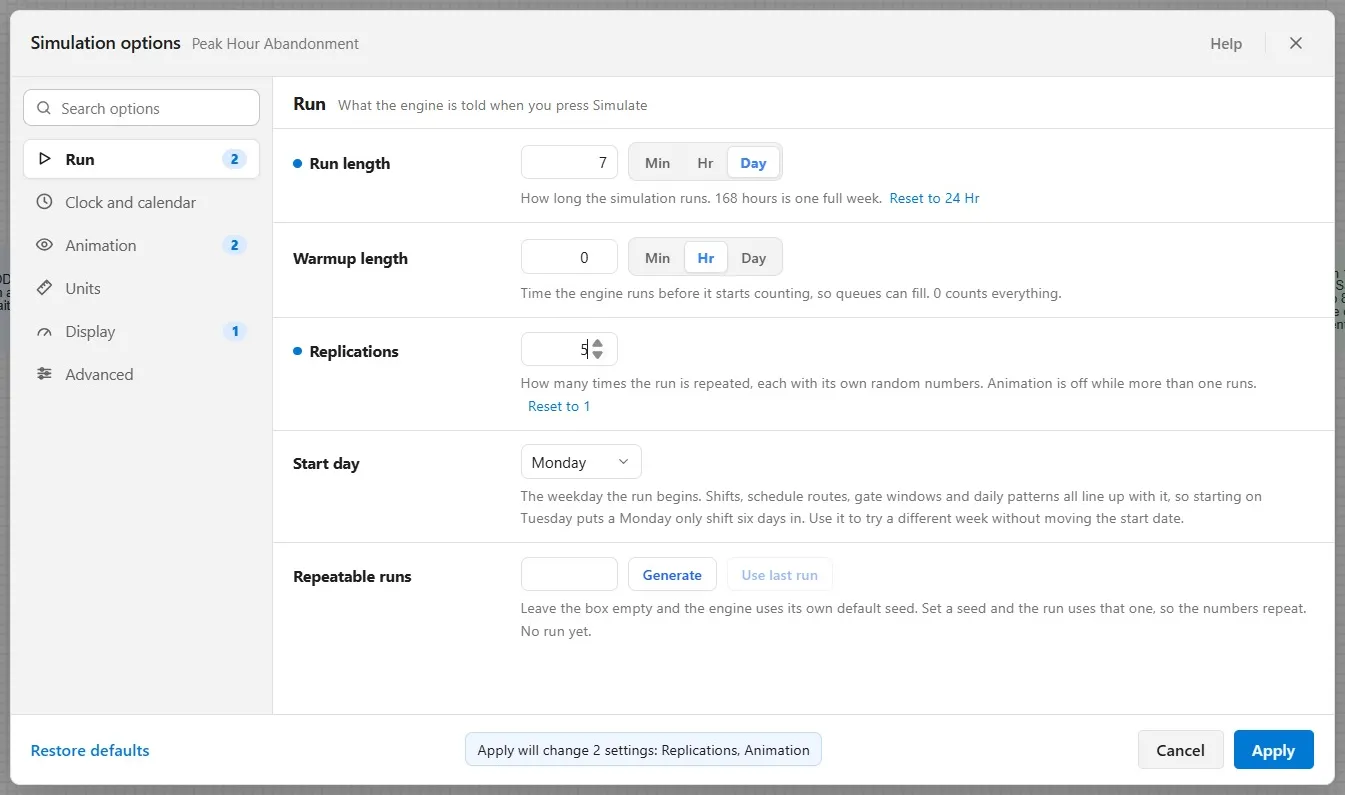
- On the toolbar, click Simulation Options. The window opens on its Run group, the settings of the run: how long the model runs, and how many times.
- In Replications, type 5. Read the line under it: animation is off while more than one runs. Five runs are played without drawing them, so they finish in seconds.
- Look at the foot of the window: it names the settings that Apply will change, Replications and Animation. It is a good habit to read this line before you apply, because it tells you exactly what you are about to change.
- Click Apply.
- On the toolbar, click Run Simulation.
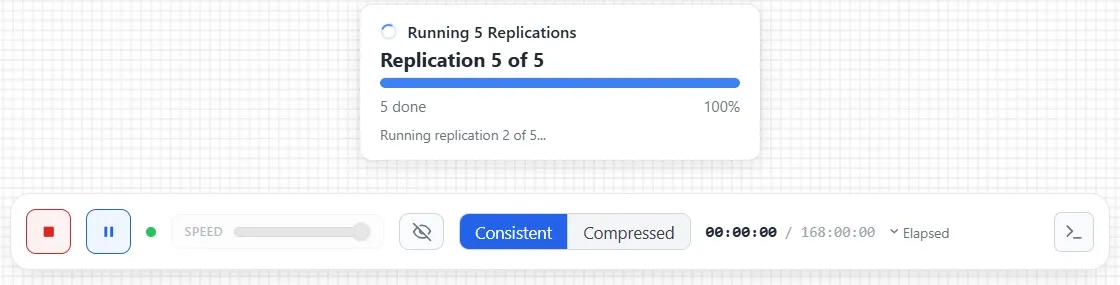
What you should see: a card that counts the runs, and the run bar at the foot of the canvas with Stop and Pause. The speed slider is grayed out: with animation off, there is no speed to set. In a few seconds the runs are done and a question appears.
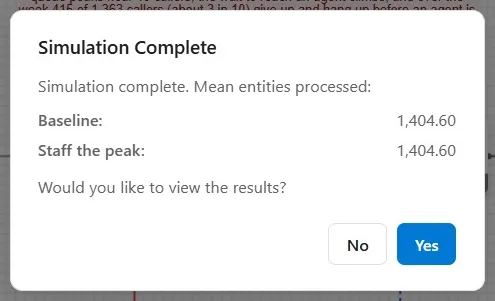
Simulation Complete reports how many calls went through on average, for the model as it is (Baseline) and for a scenario the demo carries. Scenarios are how you try a change side by side with today’s process; Chapter 12 teaches them.
Step 8. Glance at the results
- Click Yes. The results open in the Output Report.
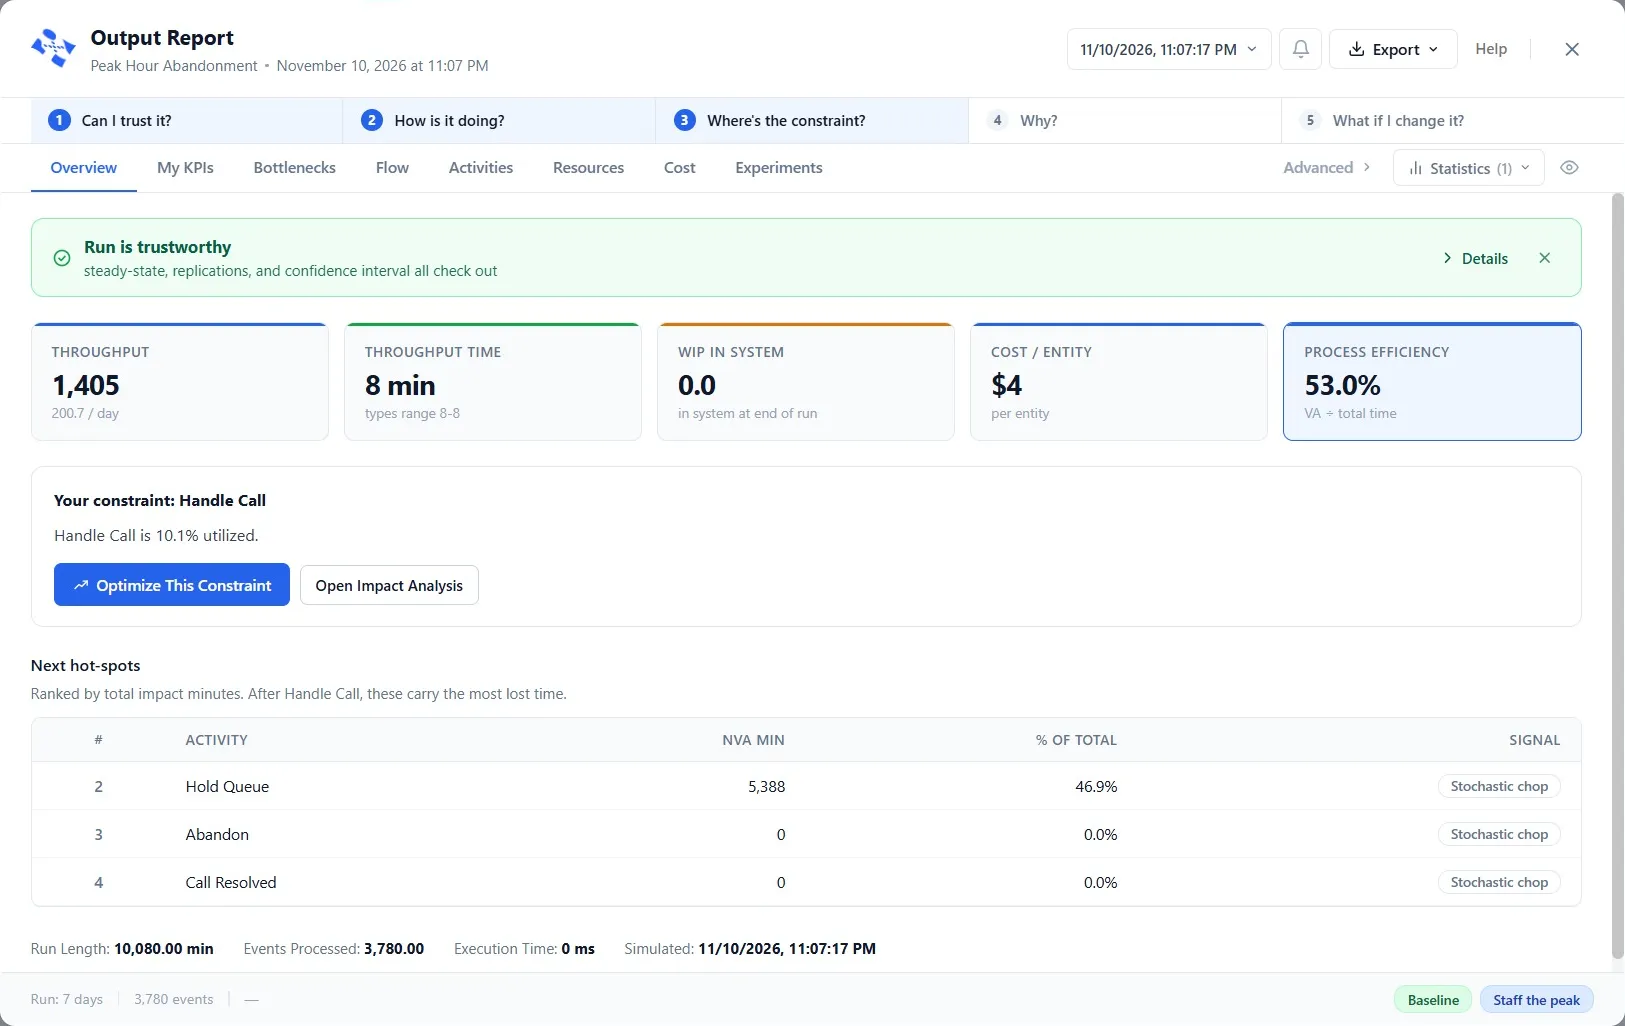
The report is built around five questions, the five a manager asks about any process: Can I trust it? How is it doing? Where is the constraint? Why? What if I change it? The green line near the top says the run is trustworthy: the five runs agree well enough to rely on. You do not need to read the rest yet: Chapter 11 is devoted to it.
- Close the report with the X at its top right.
Step 9. Know where Help is
- Click Help in the menu bar.
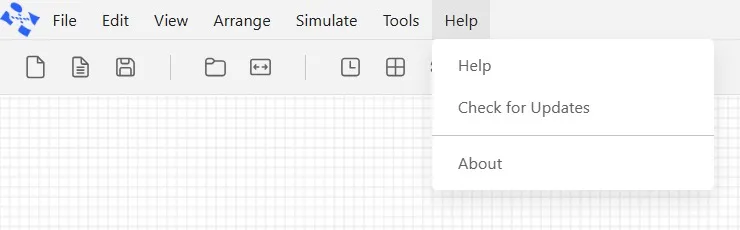
Help opens the website’s help, these pages, in your browser, whenever you need it. Check for Updates looks for a newer version of ProcessModel, and About shows which version you have.
- Press Escape to close the menu.
When you close the demo, ProcessModel asks whether to save your changes, because you changed its run settings. Choose Don’t Save: the demo in Demo Models stays as it was either way.
Your practice model
This chapter’s practice model is the demo you just opened: Peak Hour Abandonment, in File ▸ Demo Models, under Services. There is no model of the course’s own for this chapter. Your own phone repair shop starts from an empty canvas in Chapter 2.
Check yourself
Try it yourself
Open a second demo on your own and find your way around it, without the steps above.
- In File ▸ Demo Models, pick any industry other than Services and open a demo that interests you. Read its brief first.
- Name its activities and resources by reading the canvas, then double-click one activity and find its Capacity and Processing Time.
- Open Simulation Options, make sure Replications reads 1 (type it and click Apply if it does not), and click Run Simulation.
Mark it done
When you can find the menus, toolbar, palette and canvas without thinking, and you have run a model and seen its report, turn on Done.
You watched this chapter's video.Not watched yet: the video is marked when it plays to the end.
Kept in this browser only, and shown on the course page.