


Balancing the resources for a software testing process can be overwhelming. Software components vary in complexity, so they need different processing times. The skill level of each resource shifts those times again. The order in which components are scheduled adds another layer, and rework loops make it harder still. This is a multi-dimensional problem that you can only guess at without simulation. The real question to answer is this: what balance of resources minimizes our cost and shortens our delivery time?
What follows is one example of how simulation and modeling apply to software development and testing. The same techniques carry over to many other software activities.
How to find the software testing model
Before going further, download the Software Testing example model. It needs ProcessModel to open and run, so make sure ProcessModel is installed first. If you do not have it yet, request a trial. It is a model package, so you bring it in with File ▸ Import: start a new model with File ▸ New, open File ▸ Import, press Choose package or drawing and pick the downloaded file. The window reads it at once and shows a report of what it found and what was adapted. Press Import and the model opens, ready for you to start reviewing how it is built.
How the model was built
Most of the objects in the model are color-coded:
- All the activities are light yellow.
- All the resources are colored and numbered.
- The squares on the light blue, green, or red background are highlighted text that describes specific paths.
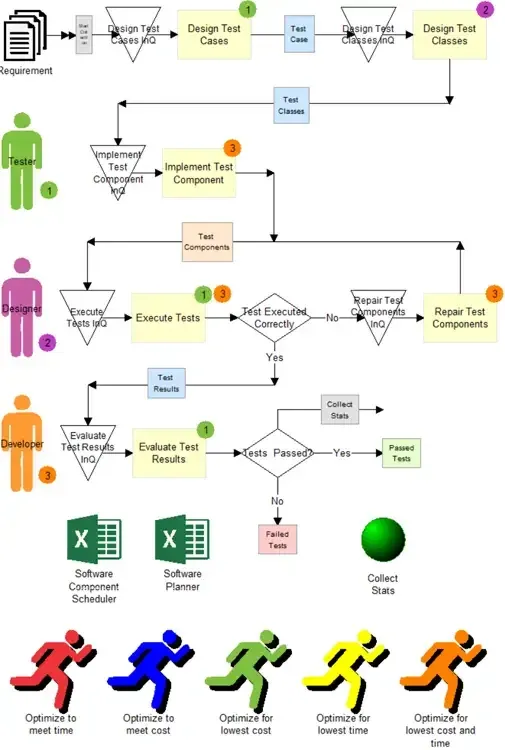
A few details are worth understanding before you optimize anything:
- Each activity has a separate input queue in front of it. To anyone familiar with ProcessModel this looks odd, since the input queue is normally defined inside the activity. Here it is separated so that action logic in the input queue can capture resources. With the queue built into the activity, that logic would not be possible. The input queue inside each activity is set to zero.
- Every activity has zero in the time field. All the times are applied through action logic using attribute values that arrive with the entities.
- Software components enter the model through a scheduled arrival. Open it and you can review every arrival and its action logic. The attributes supply the processing time at each station.
- The three resources on the left each have a plain number as their quantity: four testers, three designers and three developers. PM Optimizer changes those quantities directly during experimentation, so there is nothing to prepare in the model first.
The model keeps the values it works with in attributes and variables. The entity attributes include a_TimeIN, which records when a component enters the input queue; a_Time_Act-Name, which holds the processing time for each entity at the named activity (defined in the scheduled arrivals); and a_ErrorRate_Act-Name, which records potential errors on that component. The variables include v_EntCheck#, an internal variable that controls resource selection, and v_Act-Name_TimeInQ, which stores how long components have waited in each input queue.
There is action logic in both the input queues and the activities. You do not have to write or change any of it.
At this point it helps to walk the basic flow. A software component arrives and goes to the input queue of Design Test Cases, where it waits for a resource. Once a resource is captured, the component moves into the activity, takes its processing time, then moves on to the input queue of Design Test Classes, and so on down the line.
Model optimization
Now try optimizing the model with PM Optimizer. Work through one example here, optimizing for the lowest cost and time, and the same steps carry over to any other goal you want to try.
Optimize for lowest cost and time
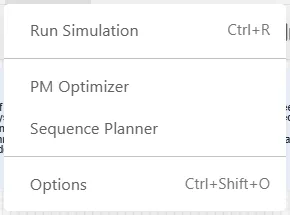
For optimization we use PM Optimizer, the optimizer built into ProcessModel. Open it from the Simulate menu, alongside Run Simulation and Option. It opens in its own window over your model, and its Define step is where you set the question.
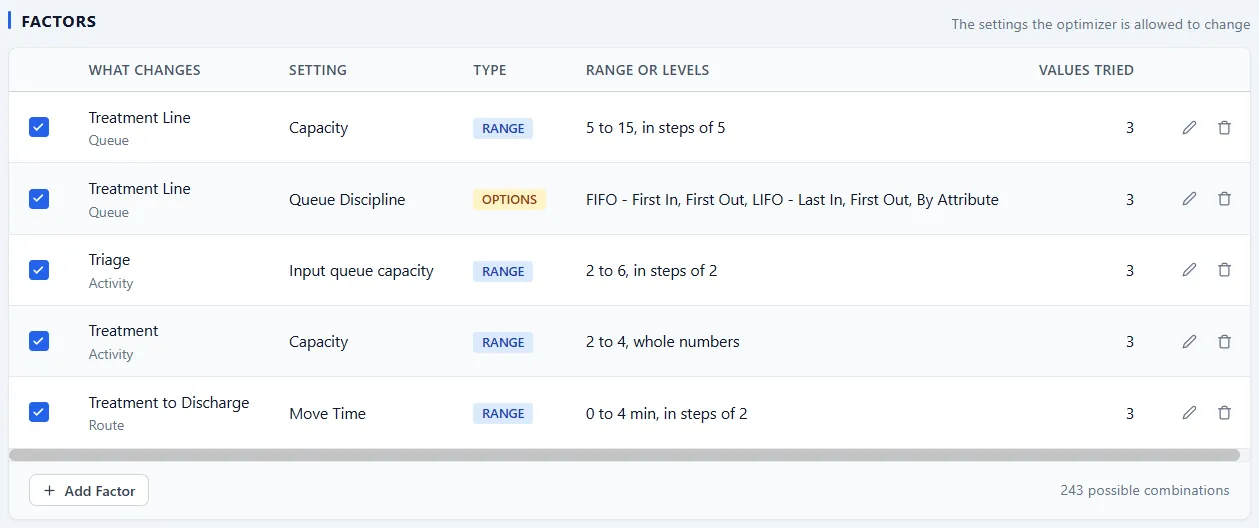
Start with the factors, the settings PM Optimizer may change. Choose Add Factor and add the quantity of each of the three resources, testers, designers and developers. Give each a range: in this example the number of testers can run from a low of two to a high of six, and developers and designers range from two to six. Here is the factors table from a triage model.
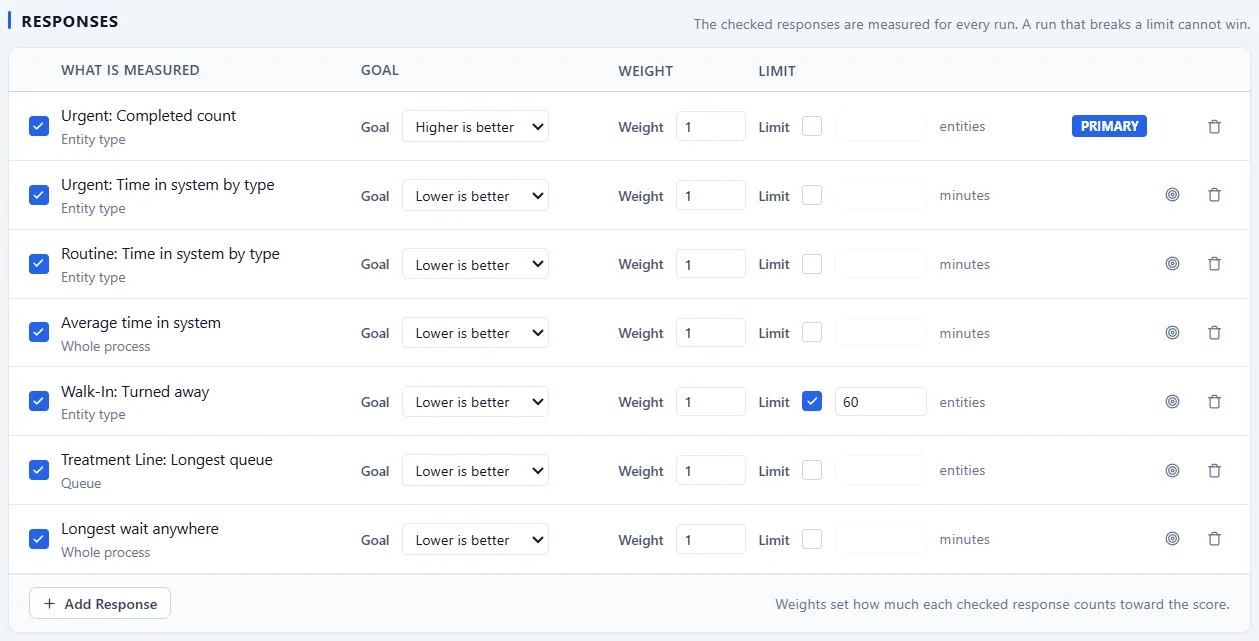
Then choose the responses, the results to measure, and give each a goal. Here we minimize the total system cost and the project duration, so add the model’s v_TotalSystemCost and v_TotalHours variables as responses. Choose Add Response and find the YOUR DATA group, which lists the model’s variables. Pick v_TotalSystemCost, and the picker asks WHICH VALUE to measure. Keep End value, which is selected for you, and choose Add Response. Do the same for v_TotalHours. Each arrives with the goal Lower is better already set. When more than one response counts, each carries a weight that sets how much it pulls the score. To make hours significant alongside total cost, raise the weight on v_TotalHours.
Leave the design on the Smart Optimizer, which runs a batch, learns from it, and chooses where to look next, then choose Save & Run Experiment. The Run step shows the best result so far as configurations finish. When the run ends, the Results step ranks every configuration, with a Baseline row for the model as it stands today and the staffing each row used, so you can see what a shorter delivery time costs. A band at the top says how sure the run is. When the leaders cannot be told apart, it says so, for example that three configurations are statistically tied for best, and suggests treating them as equally good and choosing on cost or simplicity. Try other goals the same way: each experiment you save is kept with the model, so you can keep one for the lowest cost, one for the lowest time, and so on.
You can probably think of changes worth trying to cut the time and cost of the work. Could higher-skilled workers help in lower-skilled areas when they are idle? What about mixing the schedule of complexity levels, say one difficult, two hard, four medium, then repeating the pattern? Each change is worth testing as an experiment of its own.
For more on finding and clearing the constraints in a process like this, read about job shop bottleneck analysis, or see how ProcessModel and PM Optimizer optimize a line.