
ProcessModel has always been good at the half of industry you can count: patients, orders, parts, calls. Ask it about a milk plant and you hit a wall almost immediately, because nobody in a dairy counts the gallons in a silo. They read a level.
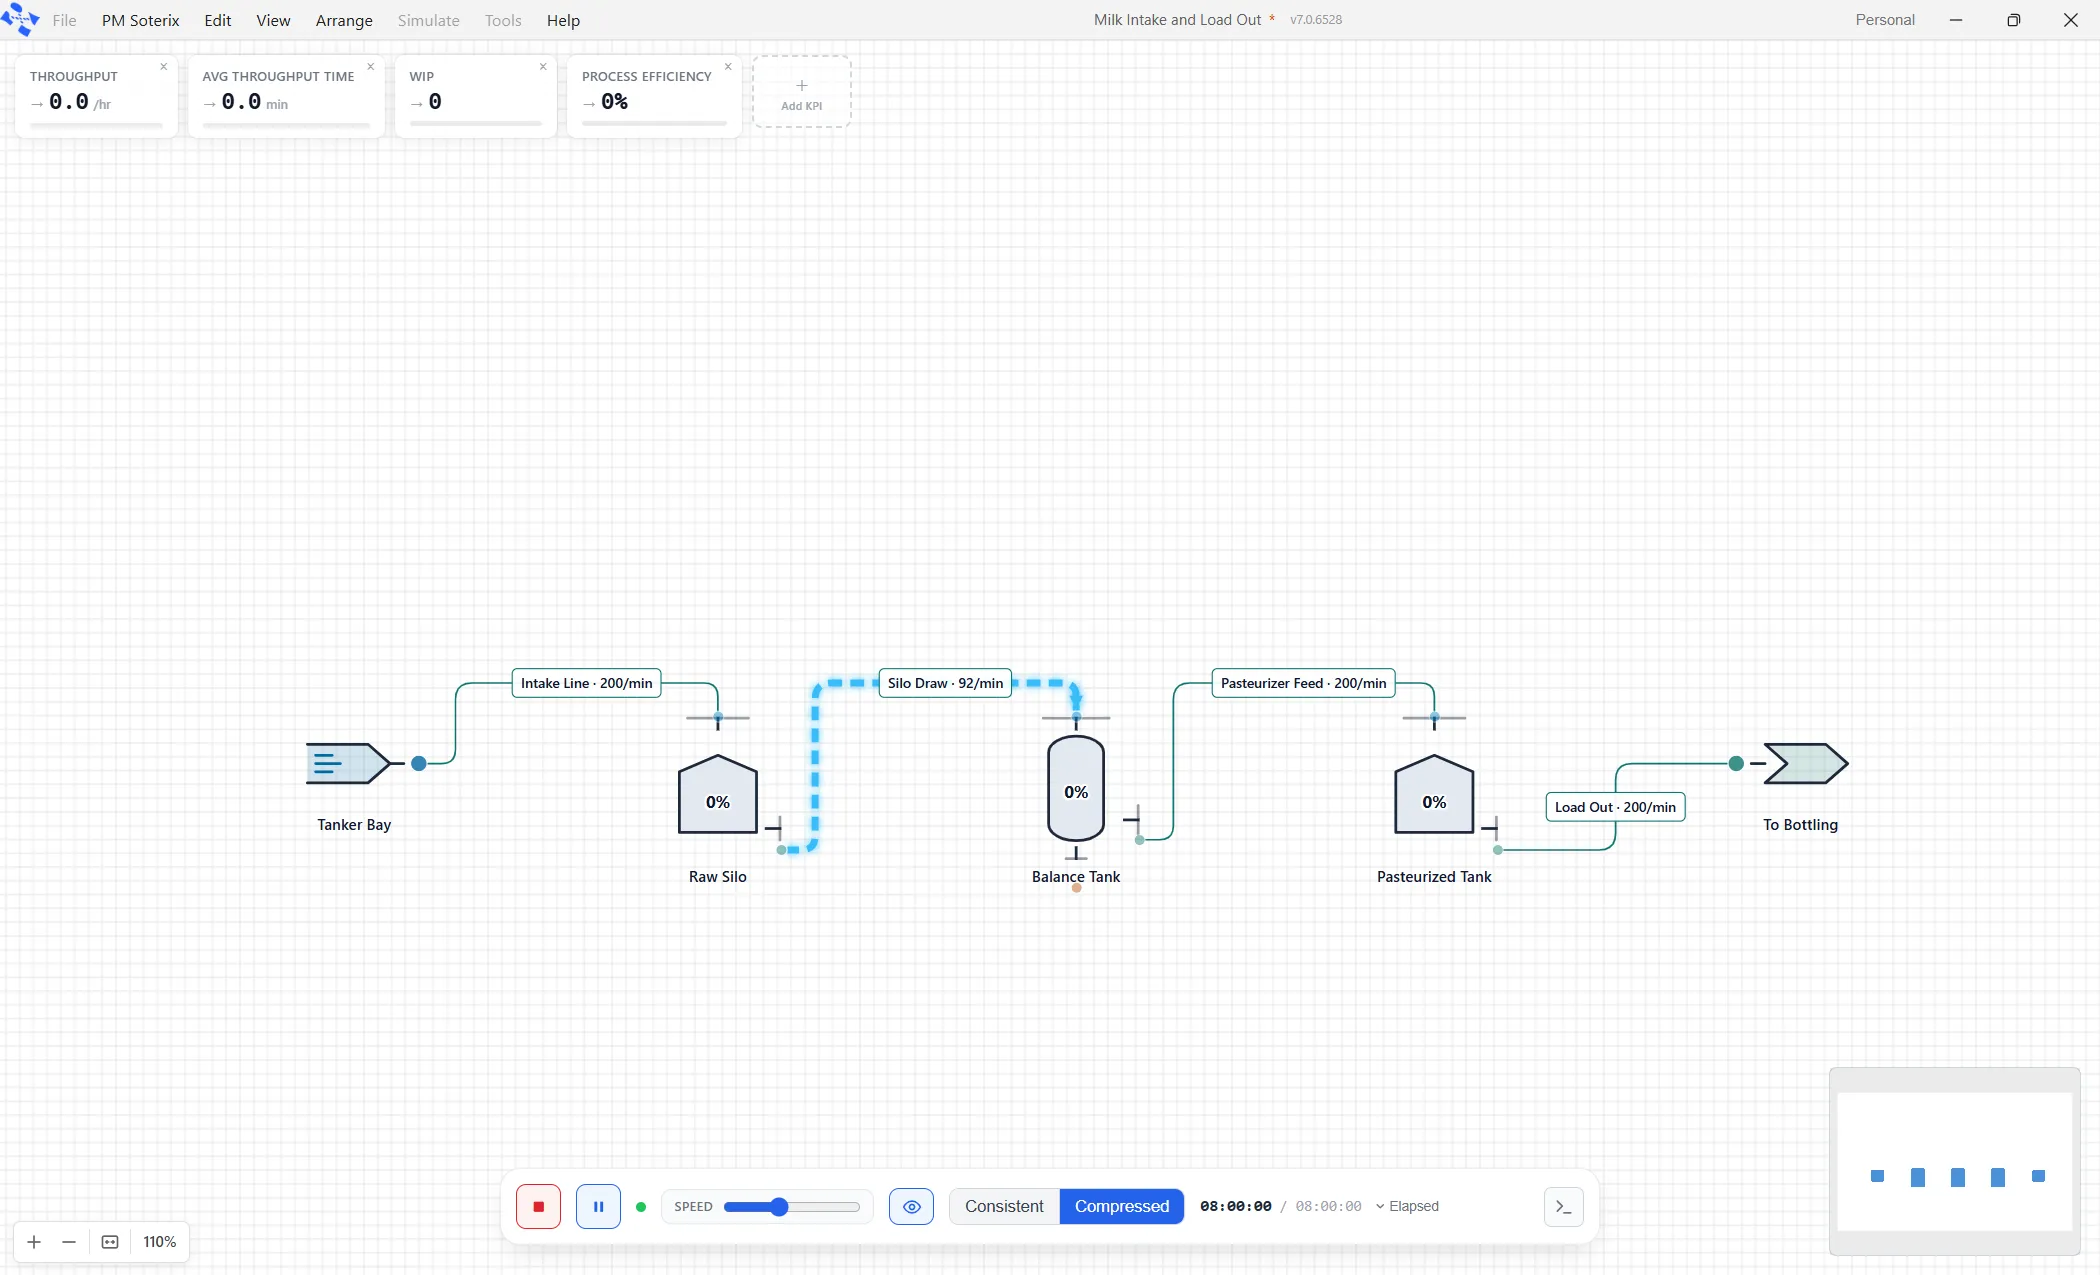
That half of the world is now modeled properly. Vessels that hold a level, transfer lines that move a quantity per minute, converters that turn measured material into countable packages, and a report that accounts for every liter.
Measuring is not counting
This is worth a minute, because it is where every first fluid model goes wrong.
A discrete model moves things you can count and asks how many are here, how long each one waited, and how many got through. A plant that handles fluid does not behave that way. A vessel holds a level. A pipe moves a set quantity per minute, decided by the pipe, not by how much is queuing behind it. There is no waiting line at all. The questions change to how much is in there, how fast is it moving, and what is stopping it from moving faster.
So the answers change too. Instead of a queue length you get a level over time. Instead of a wait you get a starved pump or a blocked line. Instead of counting units through a station you close a mass balance.
The parts arrive ready for the job
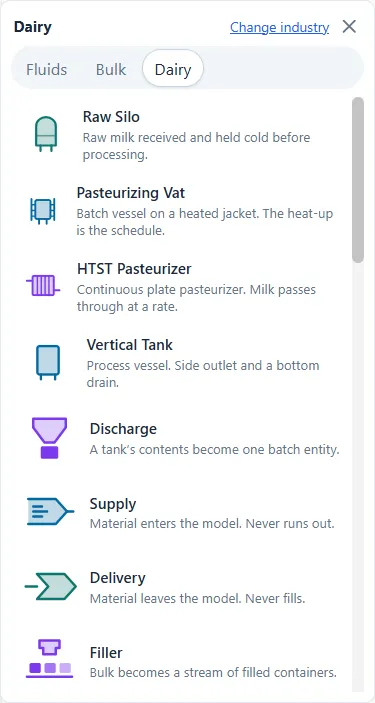
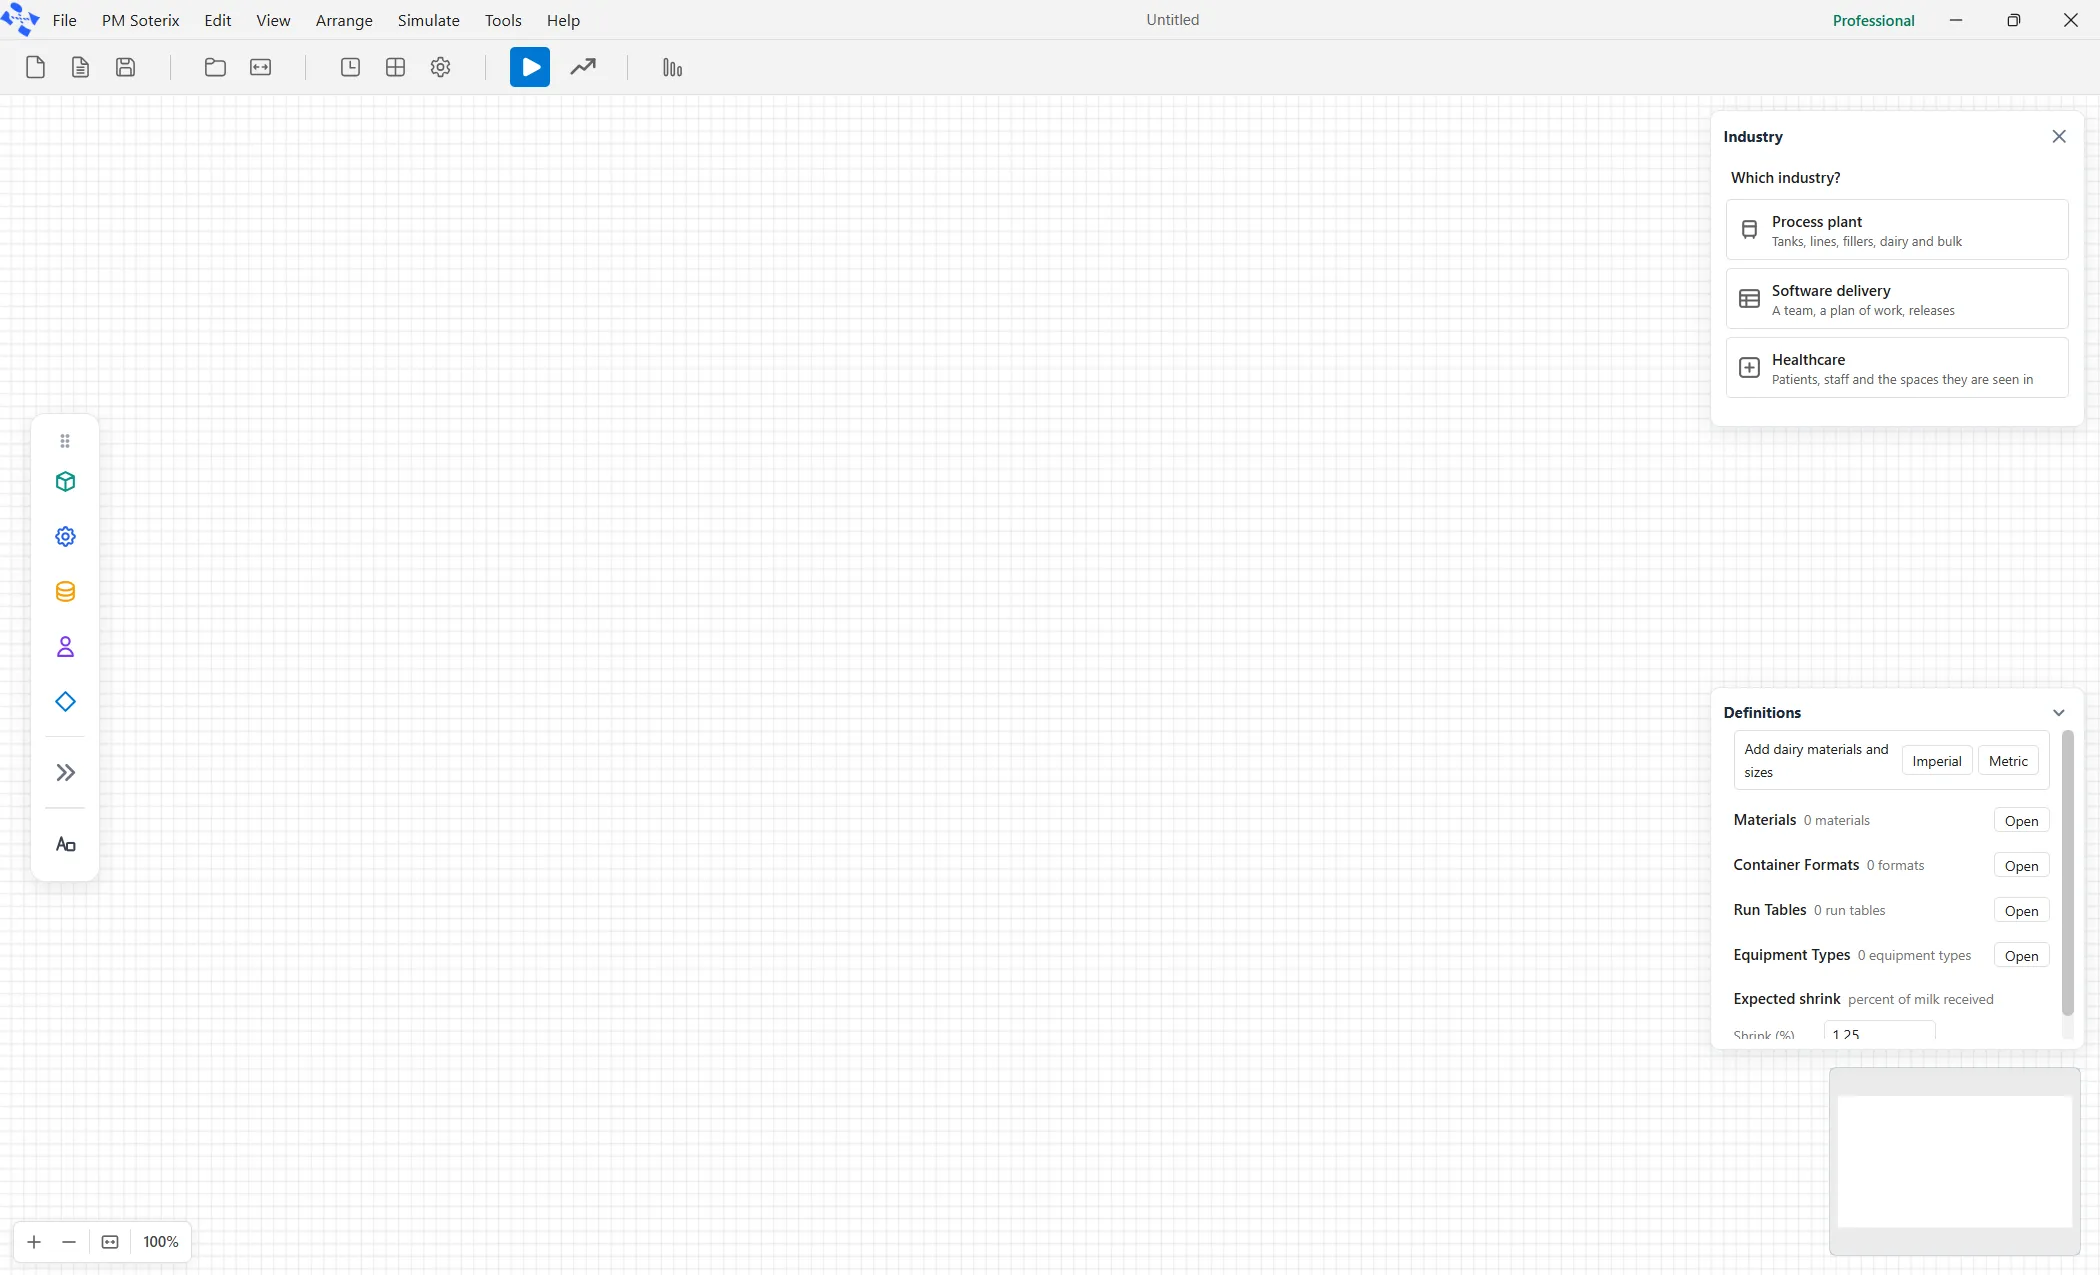
Open View, then Show Industry Palette, and pick the face that matches your plant: Fluids, Bulk or Dairy. Each one offers the same underlying vessels, pipes and converters, arriving already sized and named for that industry, with a line of description on every tile.
A dairy model gets tanks and vessels, transfer lines with real rates, a manifold for splitting and blending, a unit operation for the steps that take time, and a filler for the moment liquid becomes countable packages. A bulk operation gets the discharges and dumpers that move solids by weight.
Two kinds of connection, and only two
Material moves on transfer lines. Entities move on routes. They are drawn separately and they are not interchangeable. A pipe between two tanks is not a route, and a route between two activities will not carry a single gallon of anything.
Almost every fluid model that runs cleanly and moves nothing has an ordinary routing arrow where a pipe should be. Learn that one rule on day one and the rest of it is straightforward.
Where the two halves meet there are exactly three converters. A Discharge turns a tank of material into one entity. A Filler turns it into a stream of filled containers. A Dumper empties an arriving entity back into a tank. Outside those three, the counted half and the measured half never touch.
A report that closes the balance
Run the model and the results open a Bulk view. It starts with every vessel’s level through the run, which tells you at a glance what you are dealing with: a straight climb is a steady imbalance between what comes in and what goes out, a flat top is a vessel that filled and stopped accepting, a flat bottom is a vessel that passed everything straight through without ever holding anything.
Under it sits the mass balance, one row per material: opening, receipts, output, losses, closing, and a residual with a verdict. Opening plus receipts, less output and losses, equals closing. If that residual is not effectively zero, material has appeared or vanished somewhere and nothing else on the page can be trusted yet. It is the cheapest honesty check in simulation, and it is right at the top.
Then the tables. Every vessel reports its capacity, what it received and delivered, its time-weighted average level, the share of the run it spent full, the share it spent down at its heel, and how many times it turned over, which is how you tell a buffer from storage. Every pipe reports its achieved rate as a percentage of its nameplate, with its time split across six buckets that always add back up to the length of the run: running, off shift, down, closed, starved and blocked.
That last table is usually where the answer is. Look down the percentage column: the pipe running at 100 percent of its rating while every other pipe runs below its own is the one setting the pace for the entire plant.
What it does not do, said plainly
The fluid elements are strong on vessels, pumps, flow rates, fixed-ratio splits and blends with exact accounting, run lists with changeovers, and washing between batches.
They are not a chemistry or thermal simulator, and they never pretend to be. No temperature is simulated. Heating, cooling and holding are expressed as a rate and a time, so a vat going from 4 degrees to 63 is an input to a duration, not a jacket being modeled. There is no pressure, pH, concentration, viscosity or fat percentage. A separator splitting cream from skim does it by a ratio you supply.
If your question is about scheduling, capacity, changeovers, bottlenecks and how much you can actually ship on a Tuesday, this models it well. If your question is about reaction kinetics, you want a different kind of tool, and we would rather say so now.
Where to read more
Start with fluid and bulk modeling for the core ideas, then tanks and vessels and transfer lines for the two elements you will use most, and the Bulk report for how to read what comes back. If you would rather learn by building, the step-by-step fluid model guide takes you from an empty canvas to a working dairy intake, and its finished model ships inside the product so you can compare. The wider picture is in what’s new in ProcessModel 7.