

Time Expression
Fit your own data to a distribution
Time Expression fits your own timing data to a distribution, ranks every fit and hands you the best-fit expression, ready to apply. Your model then runs on the shape of your data, not on a guess.
The 14-day free trial includes the full app, Time Expression too. ProcessModel runs on Windows and macOS.
Why Time Expression
Your data, not a guess
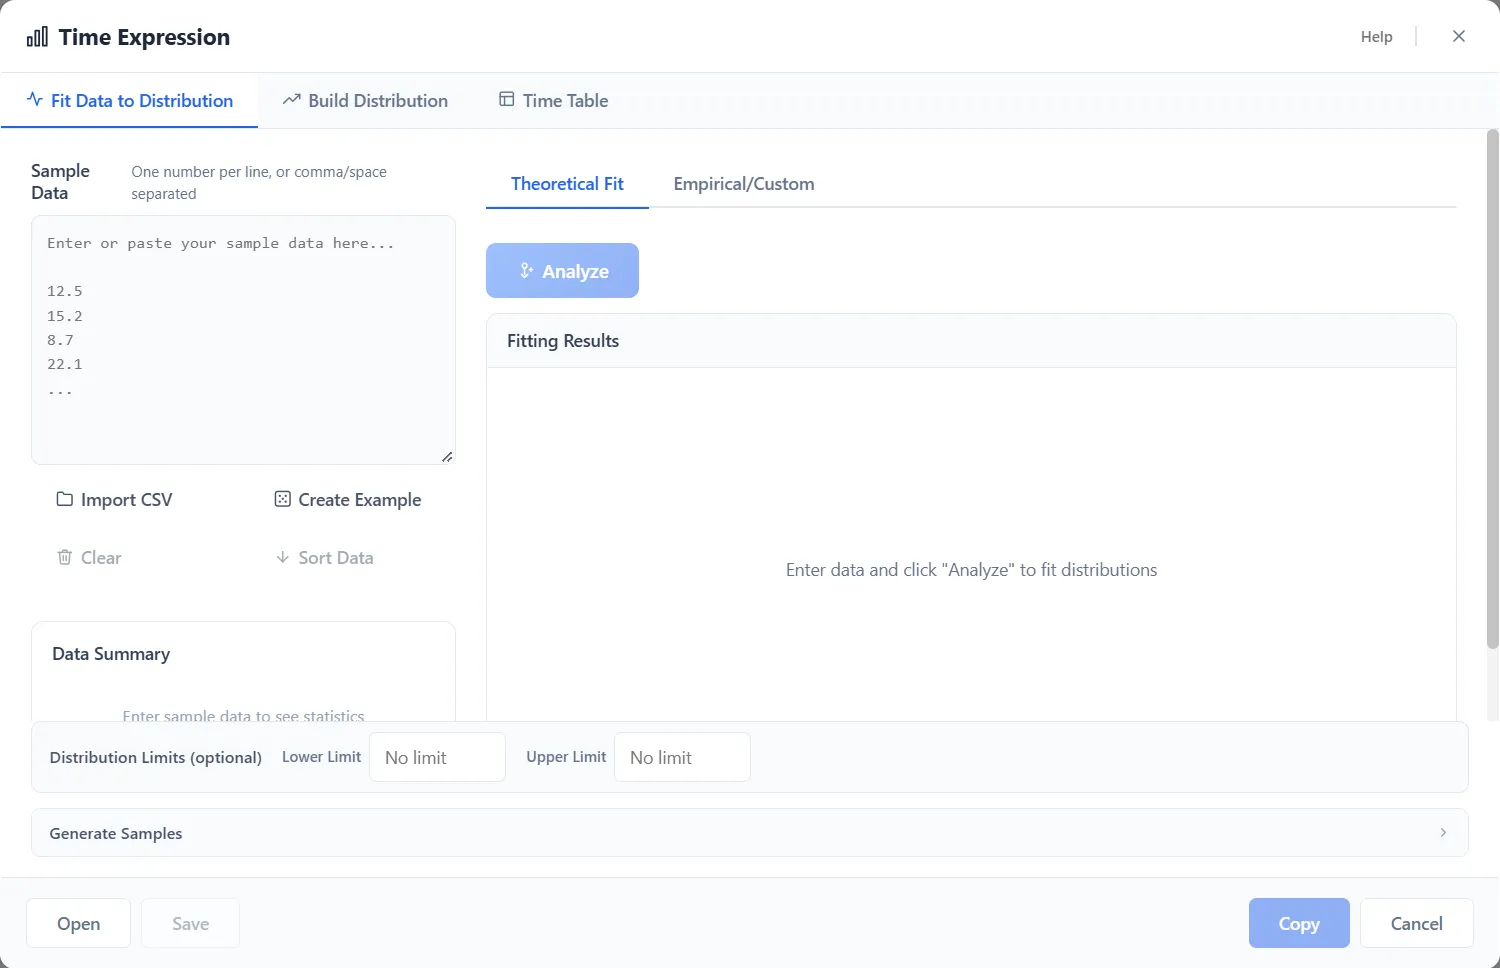
Paste or import your own times, one number per line or separated by commas or spaces. Time Expression fits every distribution it knows to them.
Every fit, ranked
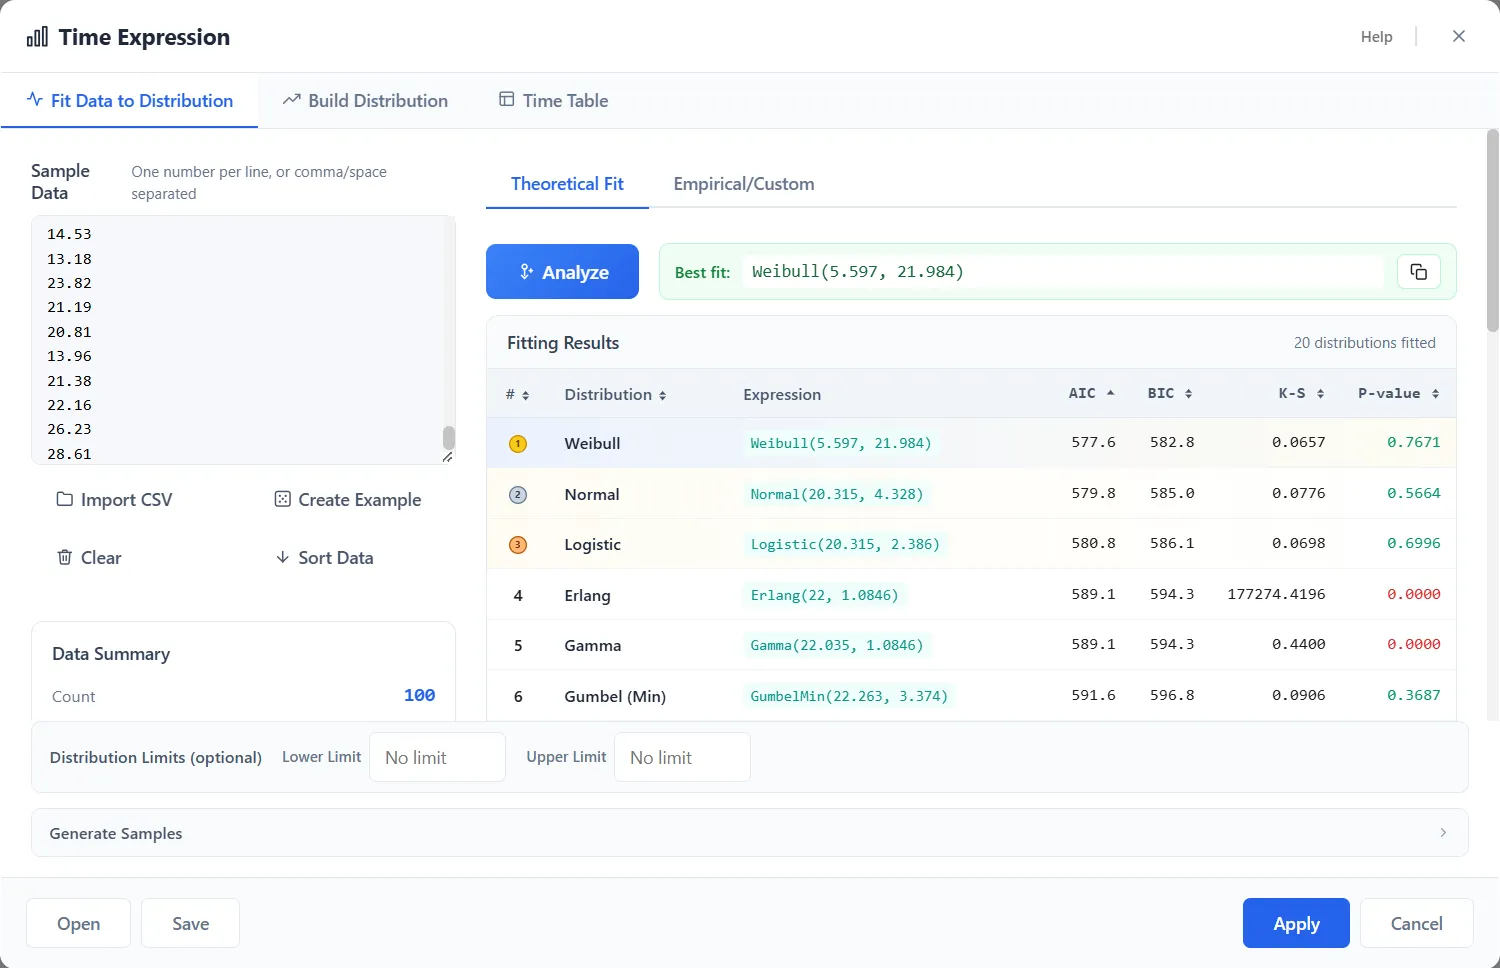
Each distribution is ranked by how well it fits your data. The best fit comes as an expression, such as Weibull(5.597, 21.984), ready to use.
No data yet? Build one
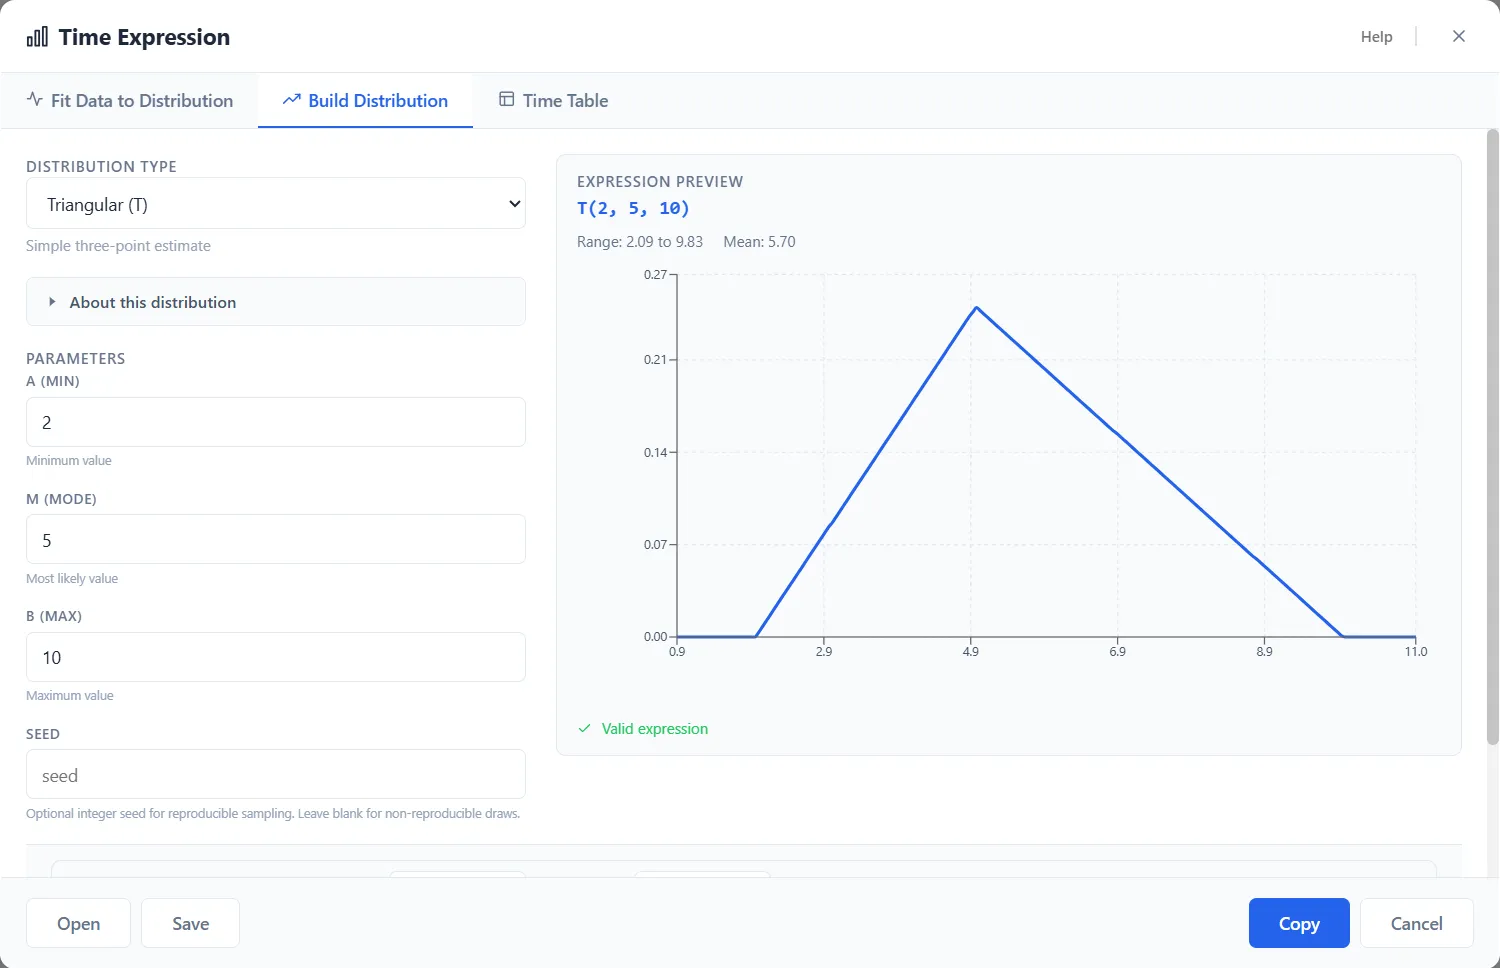
Pick a distribution type and enter its parameters. A live preview shows the expression and its shape as you type, and you can set lower and upper limits.
How it works
From a column of times to a distribution in your model
Open it from any time field
Open Time Expression from any time field and it builds a valid expression for you, so you do not have to remember the syntax. You can also open it on its own from the Tools menu or with Ctrl+Shift+T. It starts on Fit Data to Distribution.
Paste your data and choose Analyze
Paste or import your times and choose Analyze. ProcessModel fits every distribution it knows, ranks them by how well each one fits and hands you the best-fit expression. Choose Apply to validate it and drop it into the field, then run the model again.
Build a distribution when you have no data
Pick a distribution type and enter its parameters. The window shows a live preview of the expression and its shape as you type, for example T(2, 5, 10) for a triangular distribution. Lower and upper limits keep sampled values within a range.
Let the entity decide the time
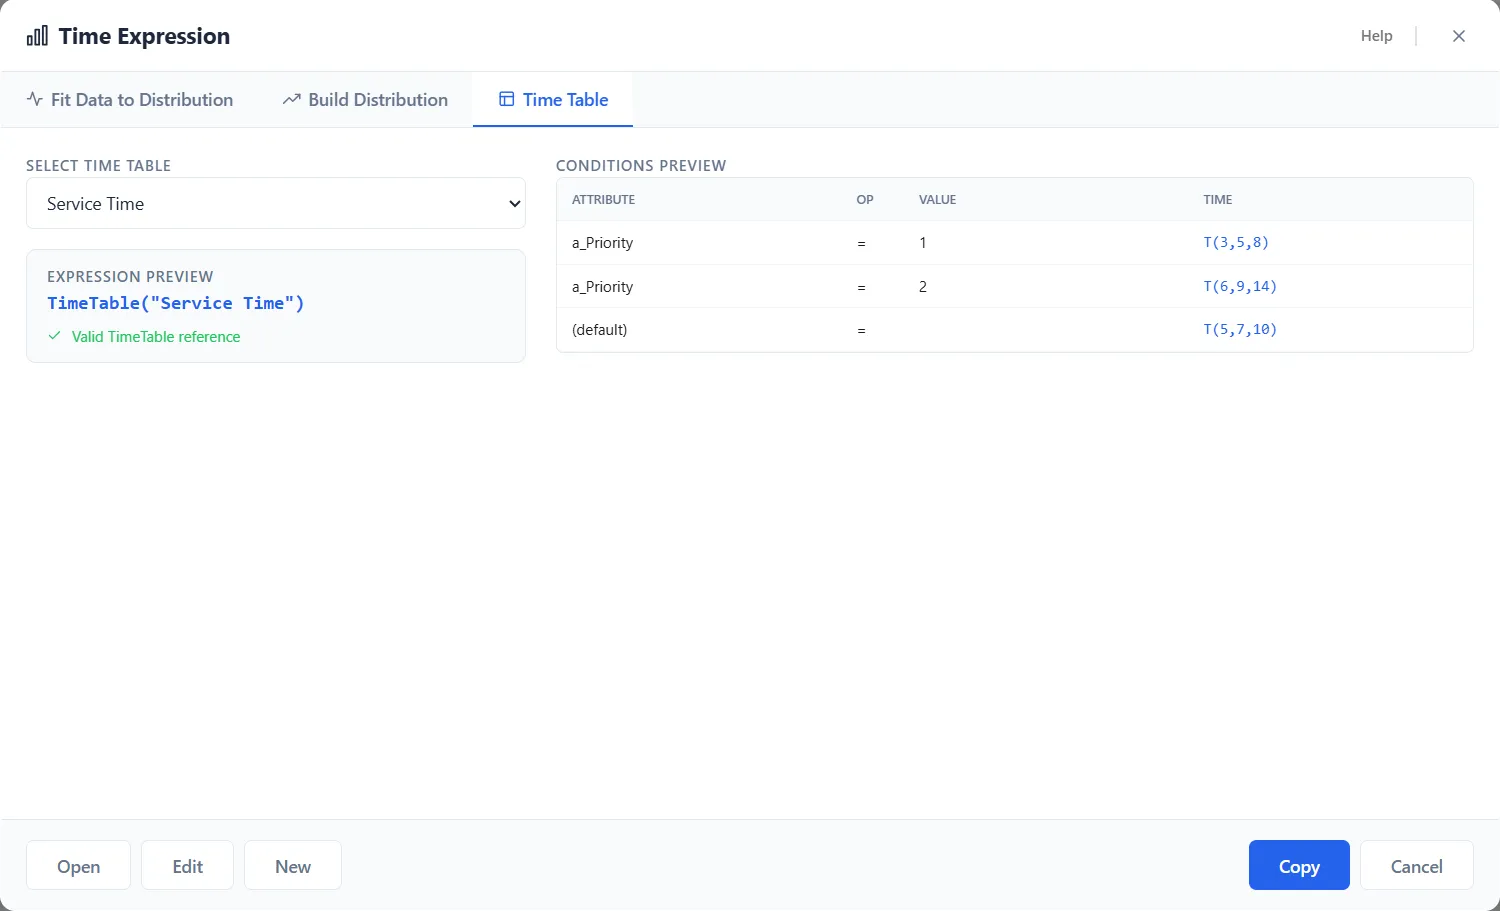
When the time depends on the entity itself, such as a service time that is shorter for one kind of customer, use the Time Table tab. Each row has an attribute, an operator, a value and a time expression, the first match wins, and a default row covers the rest.
What it can do
What Time Expression does
Fits your data to a distribution
Paste or import your data and it fits every distribution it knows, ranks them and hands you the best-fit expression.
Builds one by hand
Pick a distribution type, enter its parameters and see a live preview of the expression and its shape.
Keeps values in range
Set lower and upper limits so sampled values stay within a range.
Writes a valid expression for you
Open it from any time field and it builds the expression, so you do not have to remember the syntax. Apply validates it and drops it into the field.
Time tables for work that differs
A table of rules on entity values gives each kind of entity its own time. Use it by writing its name in quotes, as in TimeTable("Inspection Times").
Checks the shape first
Generate a sample of values to check the shape of a distribution before you commit to it.
Saves and reopens
Save a distribution you built or fitted, and open it again later.
Works on its own, too
Open it from the Tools menu or with Ctrl+Shift+T, with no field waiting. Its main button reads Copy and puts the finished expression on the clipboard.
Questions
Questions, answered
What is Time Expression?
Time Expression is the window that writes the time and distribution expressions that drive your model, such as an activity's processing time or a route's move time. It has three tabs: Fit data to distribution, Build distribution and Time table. Open it from any time field, from the Tools menu or with Ctrl+Shift+T.
Do I still need Stat::Fit to fit my data?
No. Stat::Fit was a separate tool bundled with earlier versions, and it is no longer included. ProcessModel has its own built-in fitting in Time Expression: paste or import your data, choose Analyze, and it ranks the distributions it fits and gives you the best-fit expression.
What is a triangular distribution, and when should I use it?
A triangular distribution is the everyday choice when you have three estimates but no data: the shortest a task could take, the most likely and the longest. It rises to a peak at the most likely value and tapers off to the two extremes. In ProcessModel you write it as T(min, mode, max), for example T(2, 5, 9). Use it for a processing time, a move time, or any value where an expert can give you a low, a likely and a high. Once you have collected real data, fit a distribution to it in Time Expression instead.
What data can I paste in?
Paste or import your times, one number per line or separated by commas or spaces. Choose Analyze and ProcessModel fits every distribution it knows to your data and ranks them by how well each one fits.
How is a time table different from a distribution?
Use a time table when the time depends on the entity itself, such as a service time that is shorter for one kind of customer and longer for another. It is a table of rules on entity values, listed under Conditions with the first match winning and a default row for when none match. Nothing in a time table reads the clock.
What unit are the numbers in?
The numbers in an expression you build in Time Expression are in the unit of the field you use it in. T(2, 5, 10) in a field set to Hours means 2, 5 and 10 hours.
Can I try it before I buy?
Yes. The 14-day free trial includes the full app, Time Expression too. ProcessModel runs on Windows and macOS.
Keep reading
More about Time Expression
Fit your own data and see what changes
Start a free trial, paste in your own times and let Time Expression rank the fit. The trial includes the full app.