

Output Report
Find the bottleneck, then prove the fix
After every run, the Output Report names your constraint, shows the pattern of the queue behind it and tells you whether to trust the numbers. Add capacity at the constraint, run it again, and compare.
The 14-day free trial includes the full app, Output Report too. ProcessModel runs on Windows and macOS.
Why Output Report
The report opens with the answer
A banner says whether you can trust the run. Five key figures show how the process did, and a Your constraint block names the busiest step and how heavily it is used.
See why the queue builds
The Bottlenecks tab ranks every wait point by the minutes it adds, then reads the pattern of its queue, such as a daily surge, an overnight build or a steady climb.
Prove the fix first
Run a change as a scenario and compare it with the Baseline. The Experiments tab says in plain words whether it improves, and where the constraint moves.
How it works
From one run to a fix you can prove
Run the model and read the verdict
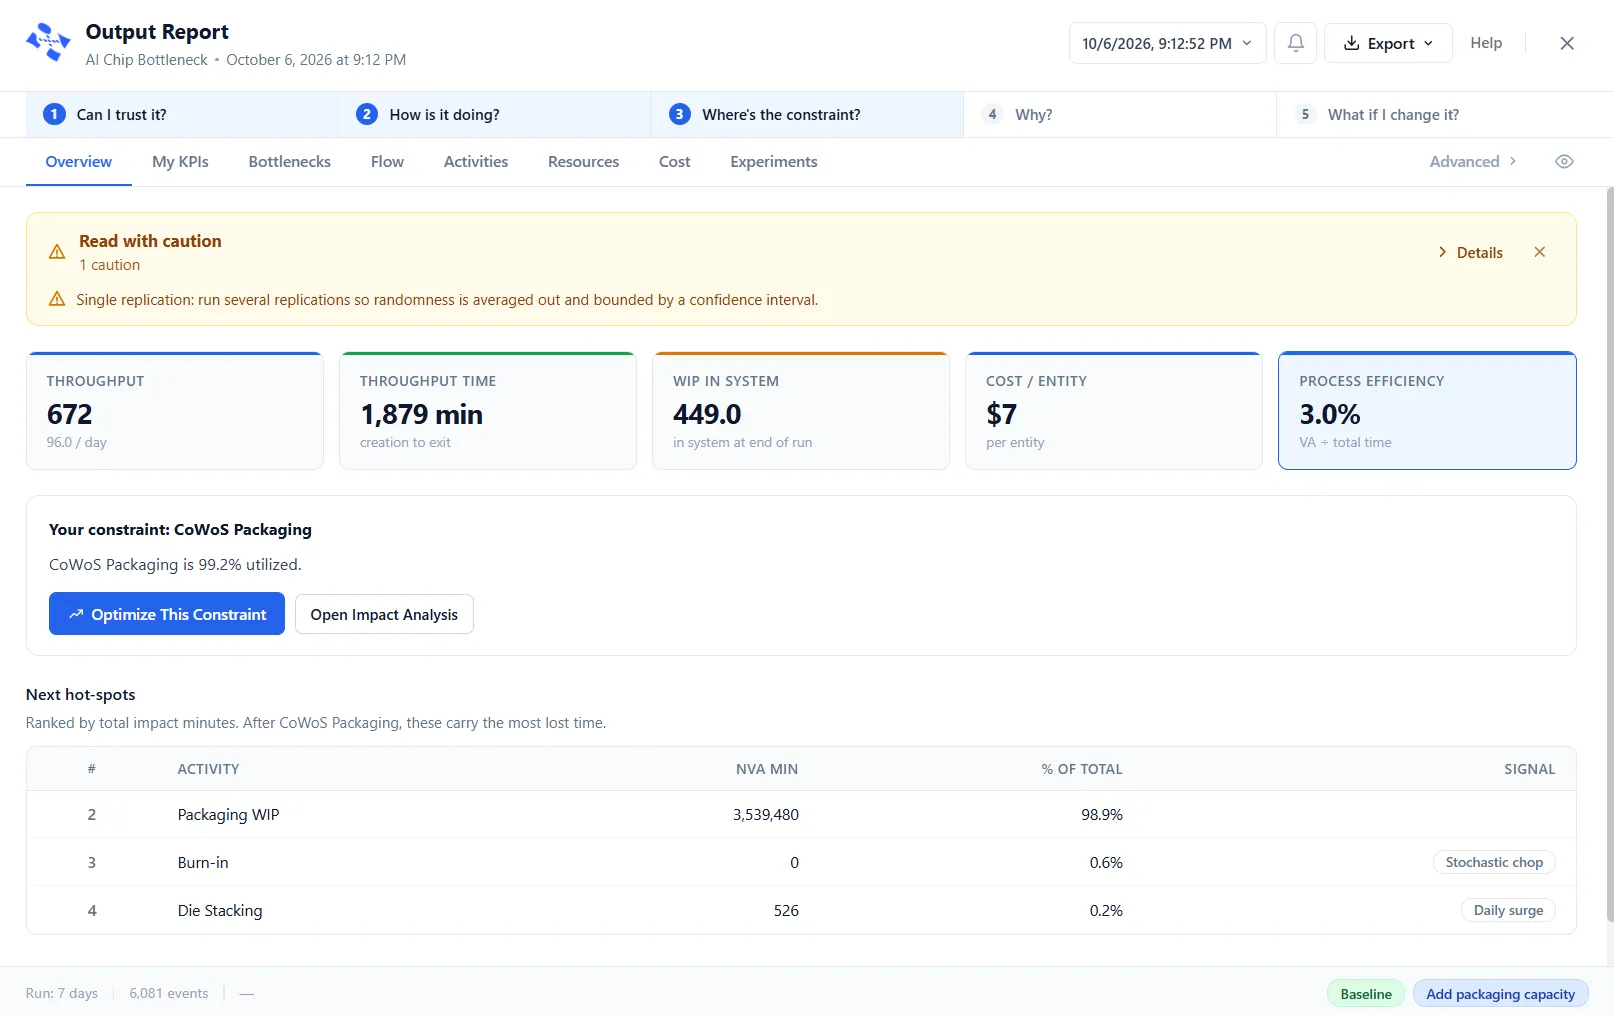
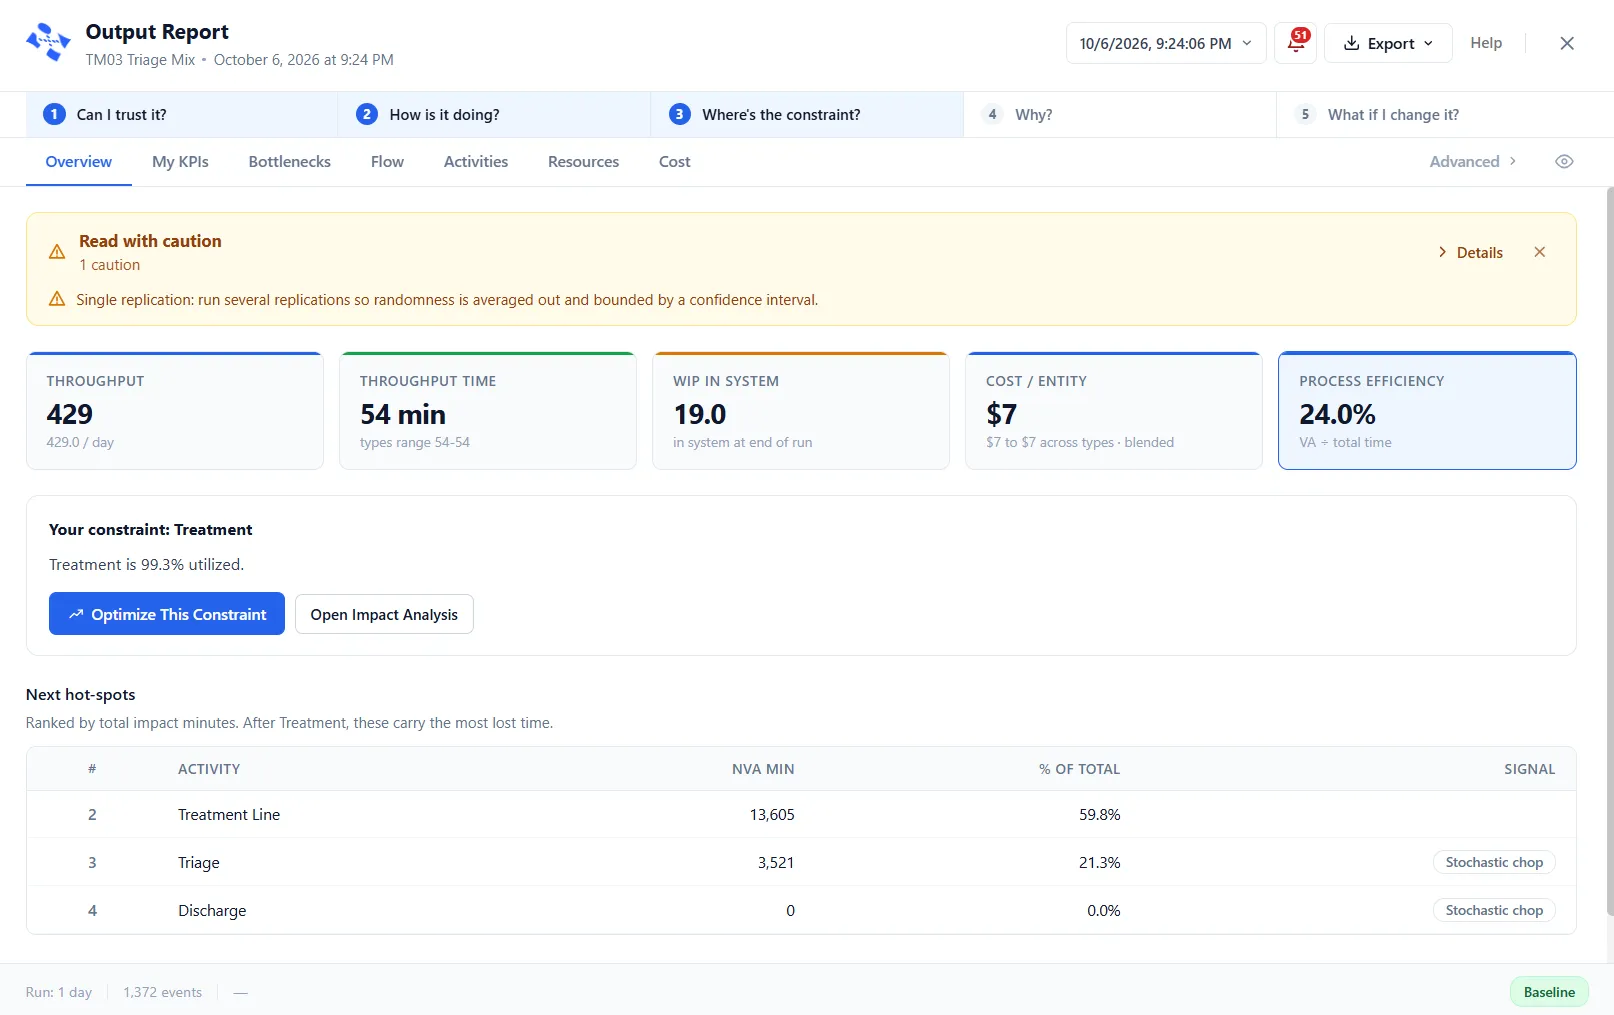
The report opens on the Overview. A banner says whether you can trust the run, in green, amber or red. Below it, five key figures show how the process did: Throughput, Throughput Time, WIP In System, Cost per Entity and Process Efficiency.
See your constraint named
The Overview names your constraint in its own block: the busiest step, and how heavily it is used. Next hot-spots ranks the steps that carry the most lost time after it. Optimize This Constraint hands the finding to PM Optimizer when you want a search for the best fix.
Find out why work waits
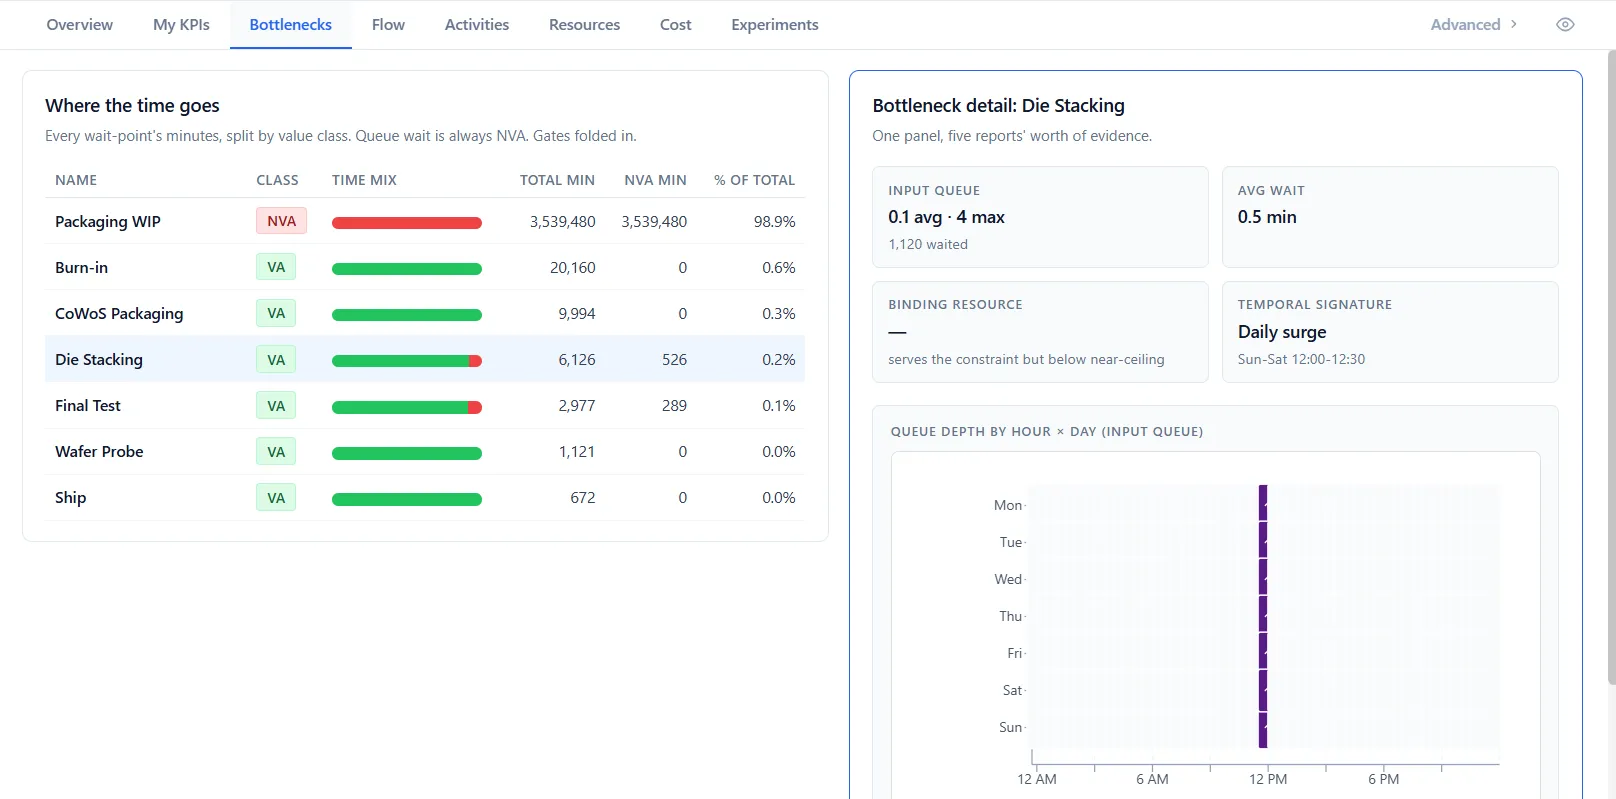
The Bottlenecks tab ranks every wait point by the minutes spent there, split by value class. Select a row for its detail: its queue depth, its average wait, the resource that binds it, the pattern of its queue and a heatmap of depth by hour and day.
Try the fix and run it again
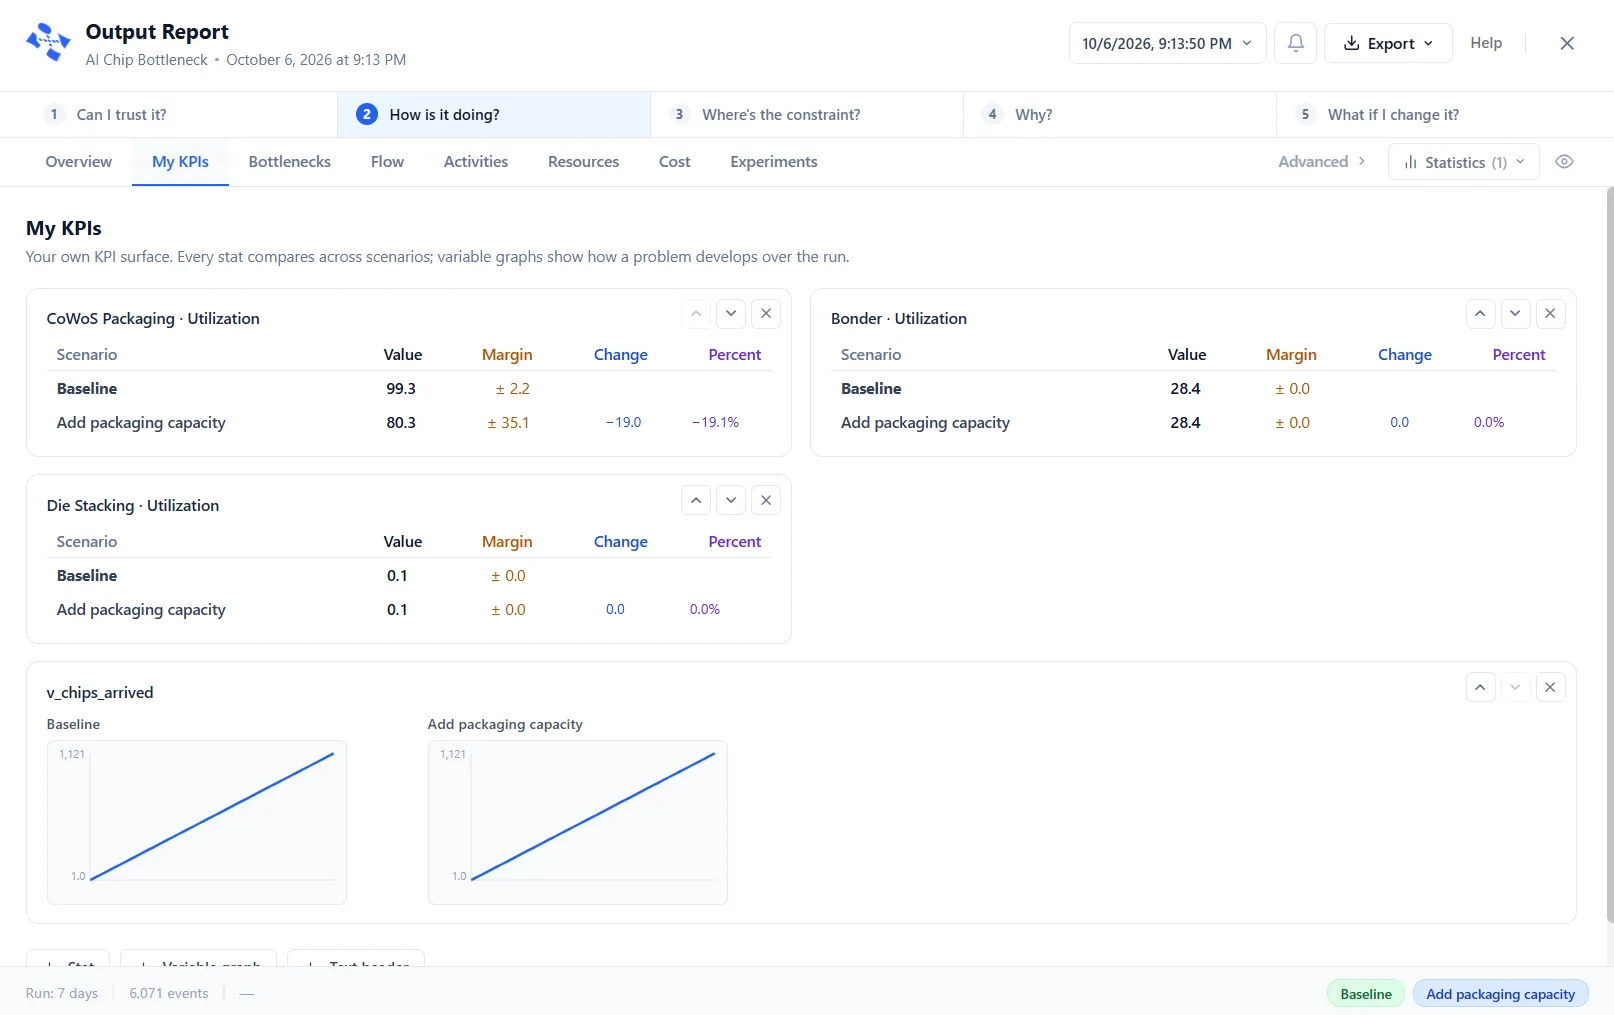
Set up a scenario that changes the constraint, such as added capacity, and run the model again. Chips along the foot of the report pick the Baseline and each scenario. My KPIs lines each figure up beside the Baseline, with the change and the percent.
Compare and read the verdict
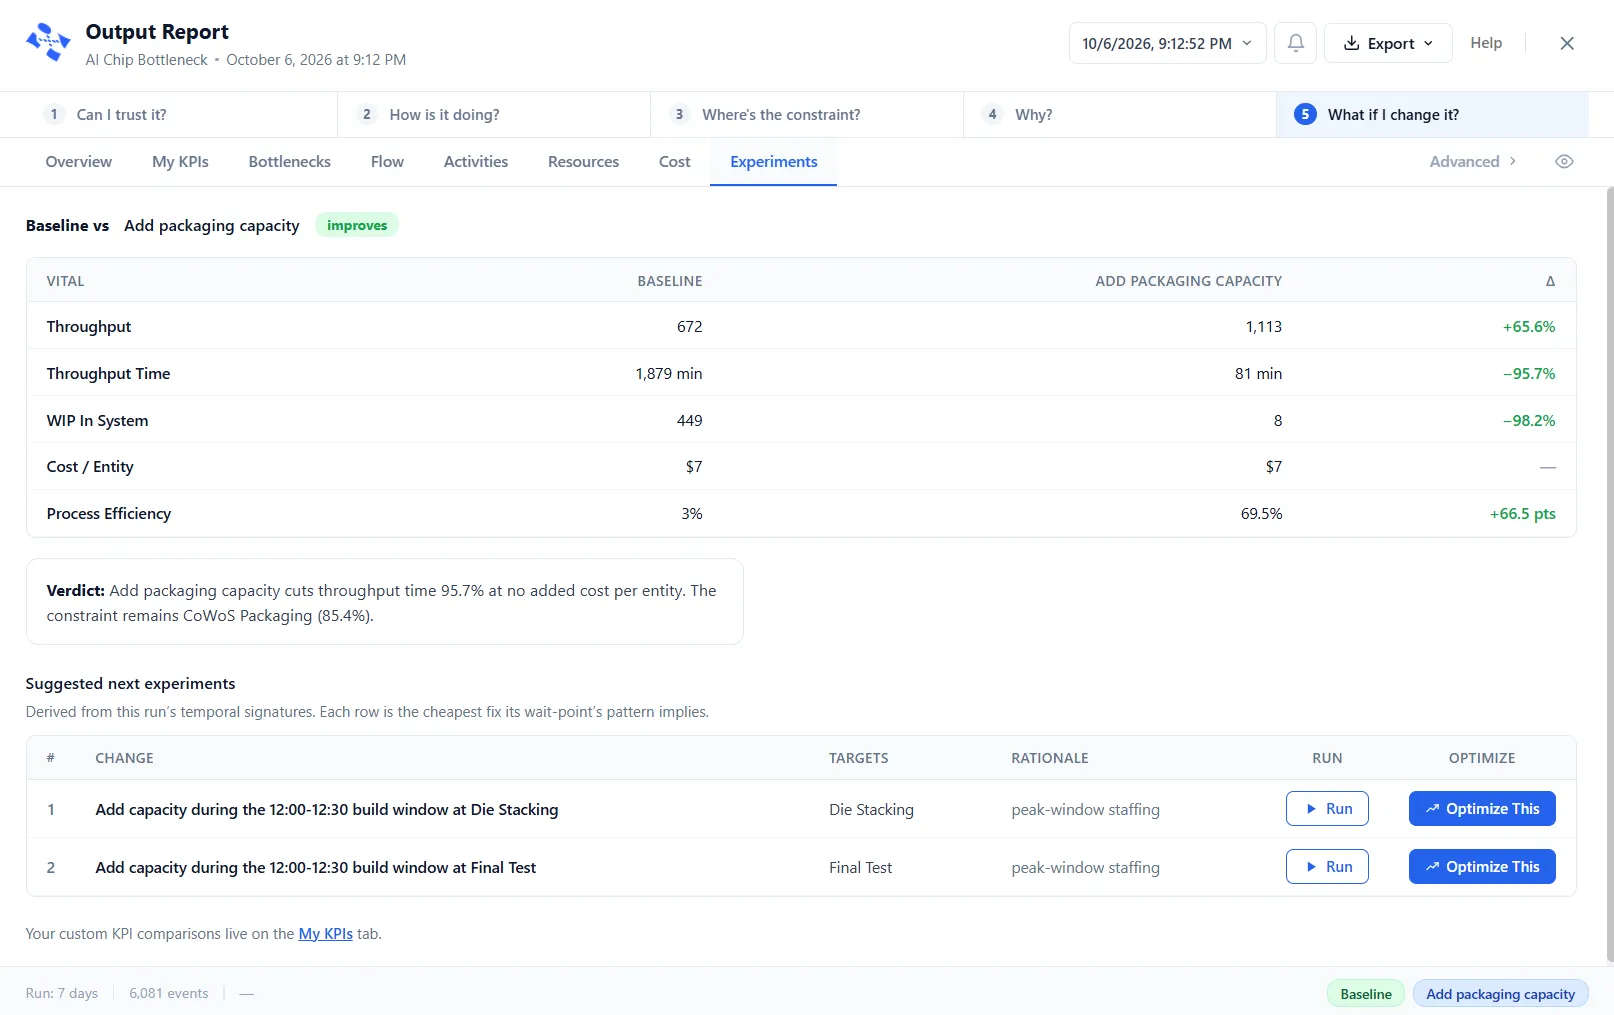
The Experiments tab compares the Baseline with a scenario on the five key figures and states a verdict in plain words, including where the constraint moves. Suggested next experiments list the cheapest fix each wait point's pattern implies, and each can become a scenario.
What it can do
What the Output Report shows
An answer-first Overview
The Overview names your constraint, how heavily it is used and the next hot-spots, so you start with the answer and not a table.
A trust check on every run
A green, amber or red banner says whether to trust the run and names anything that fell short, such as a single replication or a run that stopped early.
Bottlenecks ranked by minutes
Every wait point, activities and gates alike, ranked by the minutes spent there, with a detail card for the one you select.
Queue Diagnostics heatmap
A heatmap of the week shows when work backs up, each cell a time of day on a day of the week, colored by how congested the queue was.
Compare scenarios
Experiments compares the Baseline with a scenario and states a verdict. My KPIs lines up the figures you choose, scenario by scenario.
Confidence across replications
The report shows the spread of the results across replications, with confidence intervals, so you know how precise each figure is.
A tab for every part of the model
Flow, Activities, Resources and Cost, and more under Advanced, each filtered, sorted and searched in the same way.
Hands the finding to PM Optimizer
Optimize This Constraint turns the finding into a ready-made experiment, already pointed at the problem.
Export and run history
Export to Excel or text, or copy any table. Run History lists your runs, newest first, and reopens a past run.
Questions
Questions, answered
How does the Output Report find the bottleneck?
The Overview has a Your constraint block that names the busiest step and says how heavily it is used. The Bottlenecks tab ranks every wait point by the total minutes spent there. Select a row and its detail card shows the queue depth, the average wait, the resource that binds it and the pattern of its queue.
How do I know I can trust a run?
A banner at the top of the Overview gives the run a plain verdict: Run is trustworthy, Read with caution or Do not trust this run. It names anything that fell short, such as a single replication, a confidence interval that is too wide, or a run that was stopped early. Open Details for the full checklist.
What does the pattern of a queue tell me?
On the Bottlenecks tab, the detail for a wait point reads the temporal signature of its queue, such as a daily surge, an overnight build or a steady climb, and shows a heatmap of queue depth by hour and day with a one-line key finding. The Experiments tab then lists the cheapest fix each wait point's pattern implies.
How do I test a fix and compare it?
Run a change as a scenario. On the Experiments tab, a suggested experiment can become a scenario with Run. It starts switched off, so enable it and run the model again. The report then compares the Baseline with the scenario on the five key figures and states a verdict in words, including where the constraint moves.
Can ProcessModel search for the best fix?
Yes. Optimize This Constraint on the Overview, and Optimize This Wait Point on the Bottlenecks tab, hand the finding to PM Optimizer as a ready-made experiment. It varies your settings across many runs to find the configuration that works best.
Does it show how precise the numbers are?
Yes. Because a model runs with variation, the report shows the spread of the results across replications, with confidence intervals. The trust banner flags a single replication, because its numbers are one roll of the dice rather than an average.
Can I export the report?
Yes. Export opens a menu with Export to Excel, Export to Text and Copy to Clipboard, and every table can also be copied.
Is the Output Report in the free trial?
Yes. The 14-day free trial includes the full app, Output Report too. ProcessModel runs on Windows and macOS.
Keep reading
More about the Output Report
Find your constraint, then prove the fix
Start a free trial, run a model and let the Output Report name what is holding it up. The trial includes the full app.